Market Overview
Risk aversion is returning to major financial markets. The good newsflow of countries beginning to reduce their lockdown conditions seems to have been priced in now. Reaction is coming off the huge sell-off on West Texas Intermediate oil (US light sweet crude oil) and how the front month futures contract expiry has precipitated a remarkable sell-off into negative territory. The massive oversupply but also oil storage at Cushing in the US reportedly fully booked, there is nowhere to store oil once it has been bought and taken delivery of. To an extent, this is kind of a technicality in the market which distorts the real outlook. With volumes of futures trading already having turned to the June contract, no one wanted to take delivery and hence being paid for taking oil. The June contract is still trading at over +$20 and so the situation will be resolved tomorrow. To add to concerns, overnight news of the ill health of North Korean leader Kim have added to a risk negative sentiment. A destabilisation and uncertainty of the geopolitical outlook on the Korean Peninsula is not what is needed right now. Subsequently, we see a retreat of risk appetite this morning, although not especially pronounced yet. Volatility on equities has picked up and is usually associated with negative pressure on equities. Treasury yields are falling, the US dollar is performing well and the Japanese yen is a key safe haven outperformer.

Wall Street closed sharply back lower yesterday with the S&P 500 -1.8% at 2823. US futures are again slightly weaker (albeit off their earlier lows) with the E-mini S&Ps -0.1%. The Asian session has been impacted by the US close but also marred by fears of geopolitical destabilisation again with ill health of North Korean leader Kim Jong Un. The Nikkei was -2.0% lower whilst the Shanghai Composite was -1.0%. In Europe, the early outlook is following the Wall Street close, with downside on FTSE futures -1.4% and DAX futures -1.4%. In forex, the risk aversion is growing once more, with USD performing strongly, but the main go to currency is JPY. The higher beta NZD is the main underperformer with RBNZ Governor Orr talking about the need for additional stimulus in May. Also, amidst the renewing risk aversion, AUD is a slight relative outperformer this morning after RBA minutes suggested a resilience to the banking sector, however it did also say that GDP could decline significantly in Q2 and remain subdued in Q3. In commodities, there is a degree of consolidation on gold, with silver falling back by around a percent. Looking at oil;, the WTI front month has rebounded to flat (from a close of -$37.60 last night), whilst Brent Crude is a more reasonable reflection, trading -2.8% lower.
Once more, there are some important European data to watch out for this morning on the economic calendar. The UK Unemployment stats for February are at 0930BST and are expected to show the rate once more at 3.9% (3.9% in January) whilst Average Weekly Earnings growth is expected to dip slightly to +3.0% (from +3.0% in January). There is though also the UK’s Claimant Count for March which is expected to jump to 172,500 (from 17,300 in February) and will show the first signs of strain of Coronavirus on the UK labour market. The German ZEW Economic Sentiment is at 1000BST and is expected to show a marginal improvement in the data for April up to -42.3 (from -49.5 in March). On to the US data later in the session, the US Existing Home Sales at 1500BST is expected to see a decline of -8.1% in March to 5.30m (from 5.77m in February).
Chart of the Day – USD/CHF
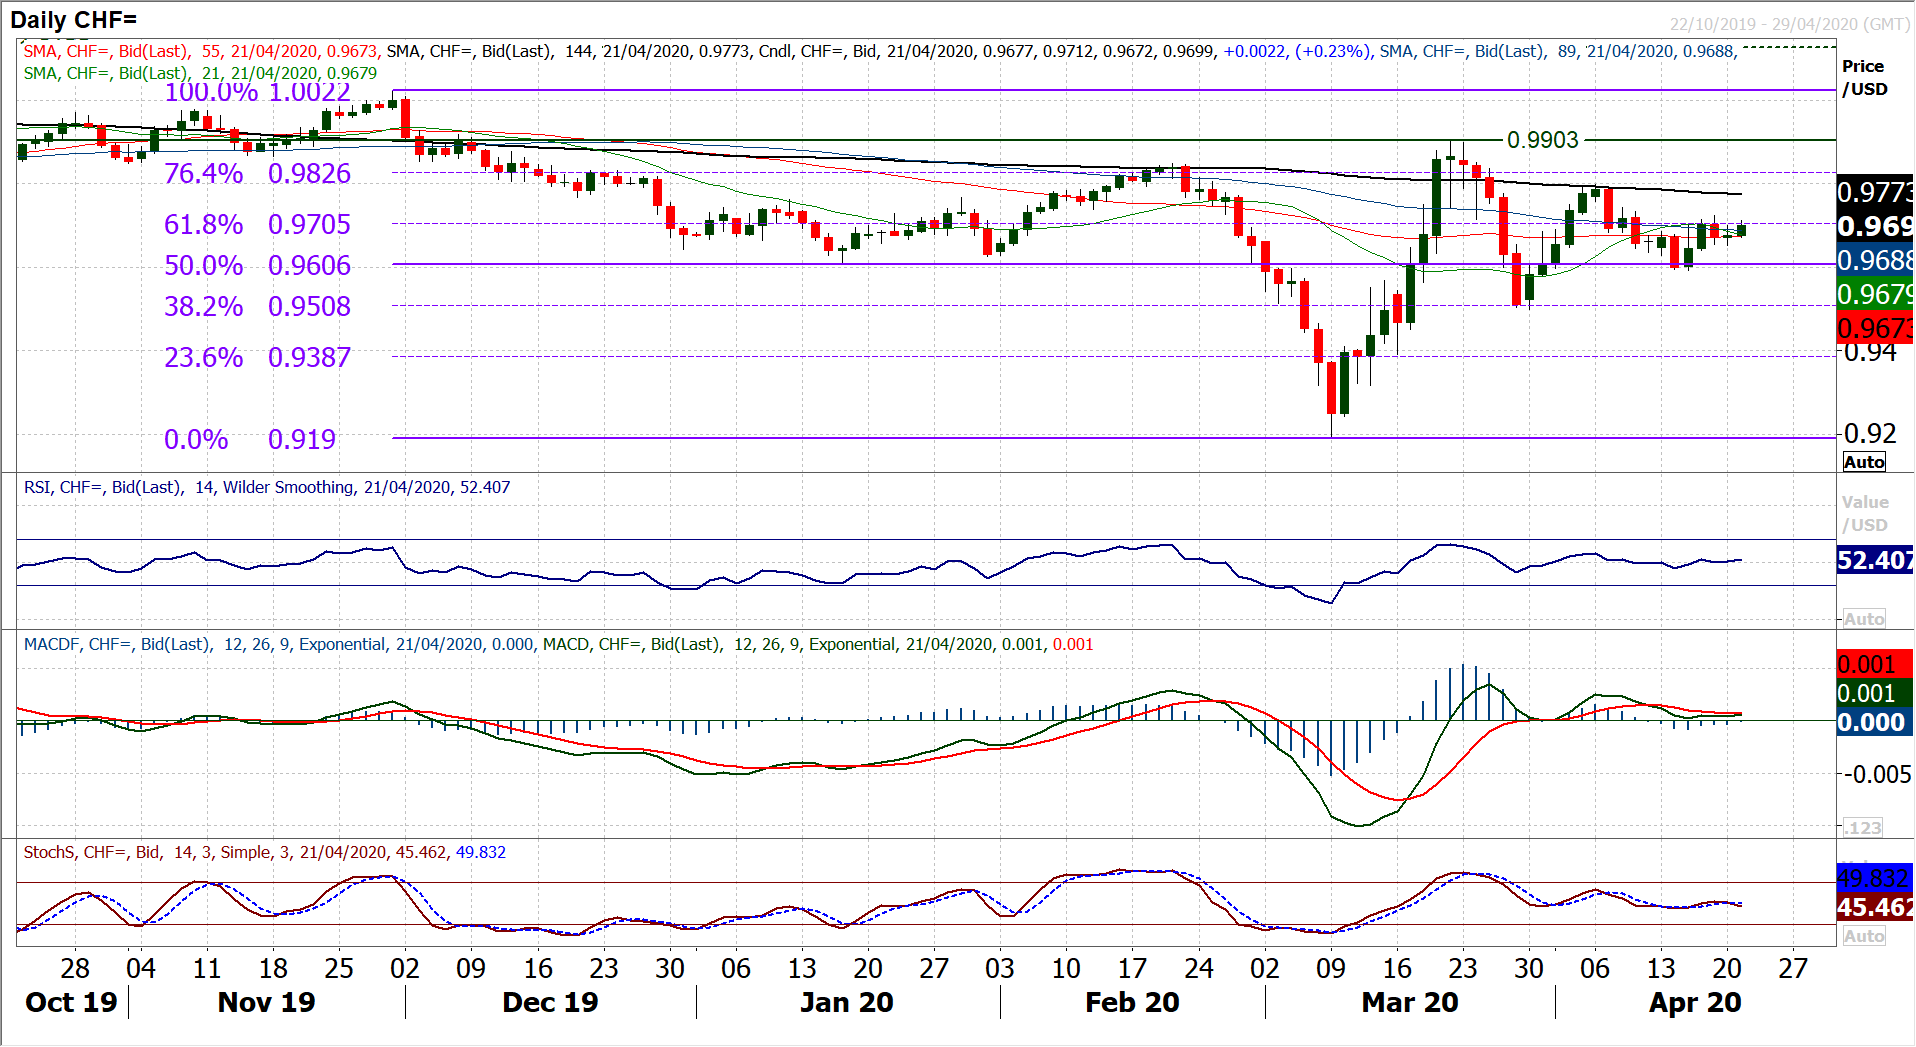
We have been seeing increasingly moderating moves on forex in recent weeks. Markets seem to have been settling down from their incredible volatility of February and March. The chart of Dollar/Swiss shows this calming of market swings very well. Since the rebound off 0.9190 hit the buffers at 0.9903, the market swings have been losing magnitude with each successive swing. We have seen the Fibonacci retracements of the 1.0022/0.9190 big November to March sell-off acting as key turning points in recent weeks. In the recent two swings lower the 38.2% Fib (around 0.9510) and 50% Fib (around 0.9605) have acted as very good gauges. The latest bounce higher has tailed off to consolidated around the 61.8% Fib (a shade above 0.9700). This comes as moving averages have converged and flattened, whilst momentum indicators have settled back almost entirely around neutral. It is like the ripples in the pool have become calm, and as such we are neutral until we see key levels breached. The market is in need of a breakout for direction now. Ticking higher thig morning, the initial level to watch is resistance, so a close above 0.9725 would edge a slightly more positive move for a test of the April high around 0.9800. Initial support around 0.9650 is protecting the reaction low at 0.9590, where a closing breach would imply a negative bias to open 0.9500 again.
EUR/USD
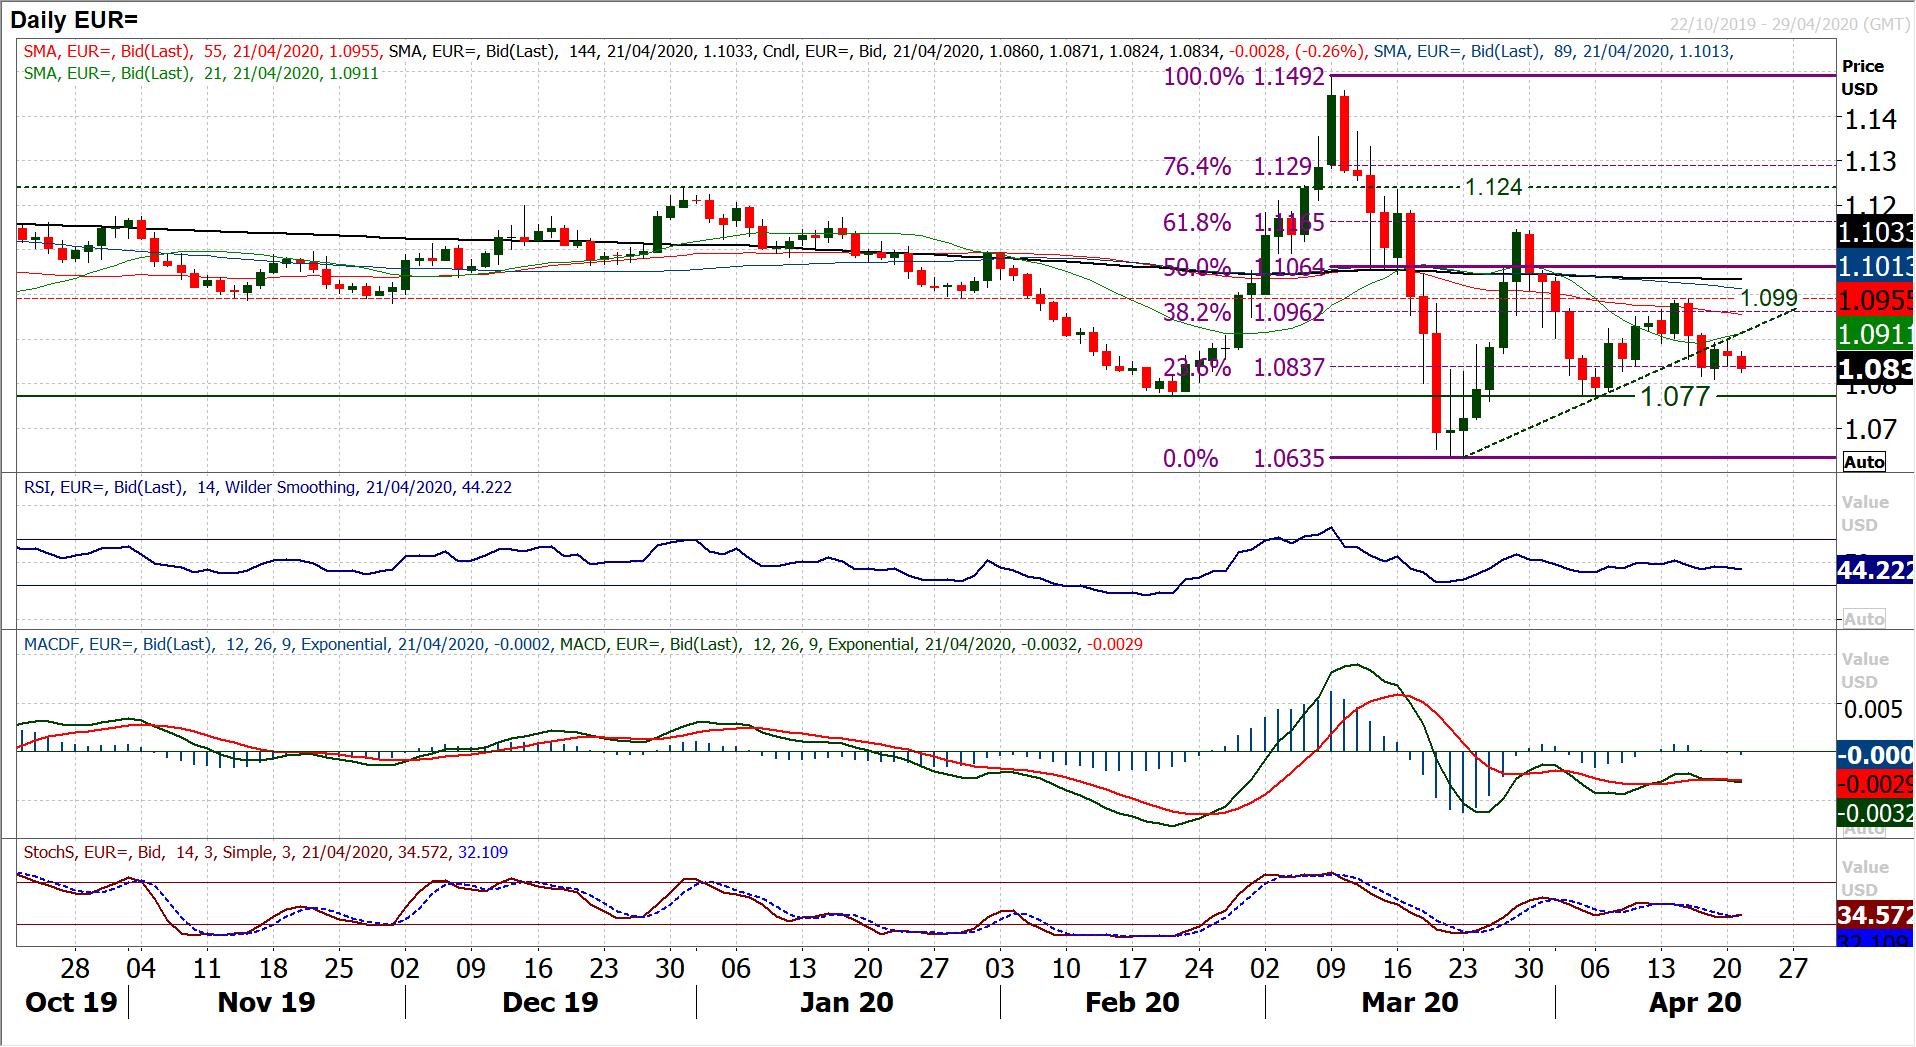
A very quiet start to the week has done little to drive direction. In the context of volatility seen in recent weeks, Monday’s very small real candlestick body in the middle of the daily range of around 65 pips is very much a session lacking in conviction. However, there is still a mild negative bias to the outlook, something which is being added to by today’s early slip lower. The market is trading under all moving averages and with momentum indicators tailing off again under their neutral positions. This is now a drift back which is eyeing a test of support around $1.0810. However, the hourly chart shows that the importance of the resistance band $1.0890/$1.0925 is growing. Furthermore, hourly momentum reflects the negative bias (hourly RSI below 40 and weighing towards 30). It suggests that rallies will continue to fade and will be seen as another chance to sell. A move below $1.0810 opens the key near term support at $1.0770.
GBP/USD
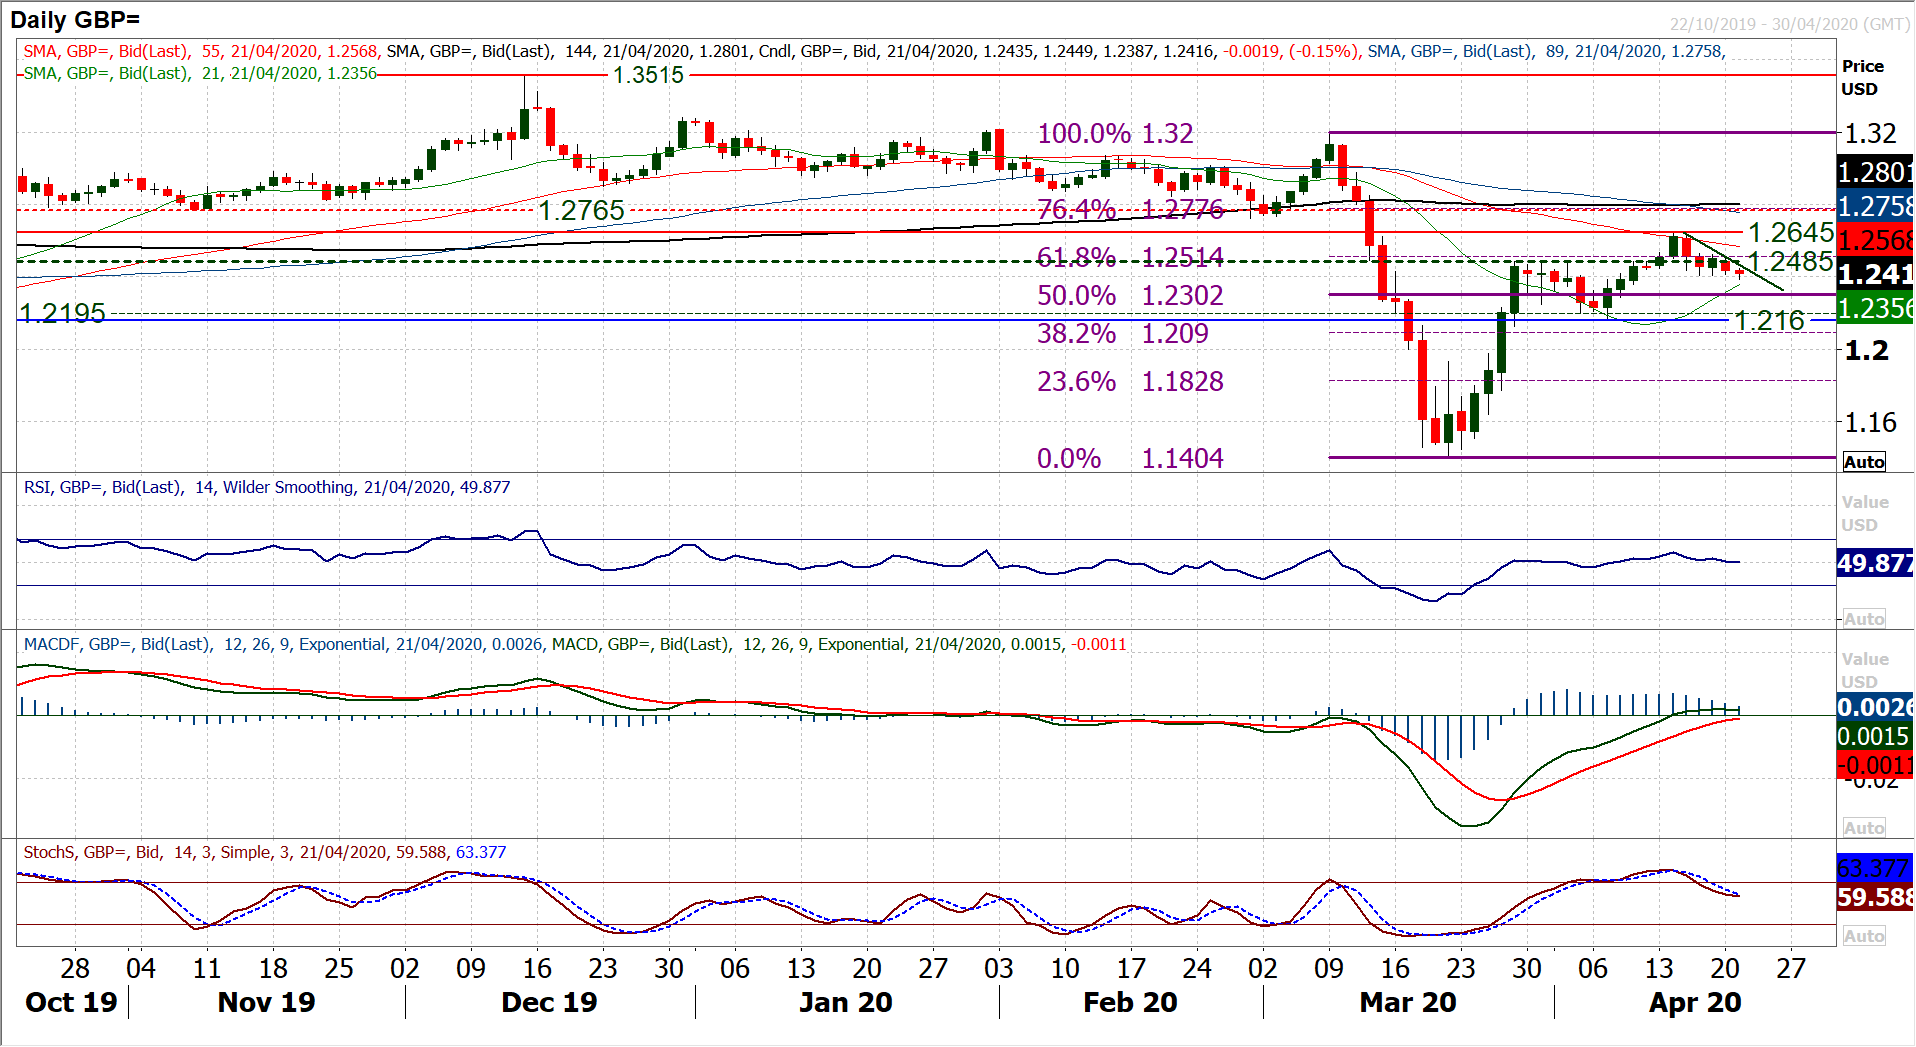
A short phase of uncertainty is beginning to resolve with an increasingly positive dollar which is dragging Cable lower. There had been a consolidation in recent sessions around the old breakout of $1.2485 but as yesterday’s session progressed, it became clear this this was turning from a consolidation around $1.2485 into using it as a basis of resistance. This growing weight of pressure has now pulled Cable below the near term support at $1.2405 to leave the market trading at an eight day low. The hourly chart shows a new downtrend beginning to take form (sits around $1.2460 this morning), whilst leaving $1.2520 as a lower high. Hourly momentum is also correctively configured now, with hourly RSI failing at 50/60 and moving towards 30. For now, this is a relatively controlled negative bias where intraday rallies are becoming a chance to sell. If the hourly RSI begins to move into the 20s, it would be a reflection of the move becoming more aggressive. On the daily chart, trading clear below the 61.8% Fibonacci retracement (of $1.3200/$1.1405) at $1.2515 has opened the 50% Fib level again around $1.2300 and this is the next target area for a controlled drift. A more aggressive sell-off opens the key higher low at $1.2160. The bulls need a close above $1.2520 to abort this growing corrective move.
USD/JPY
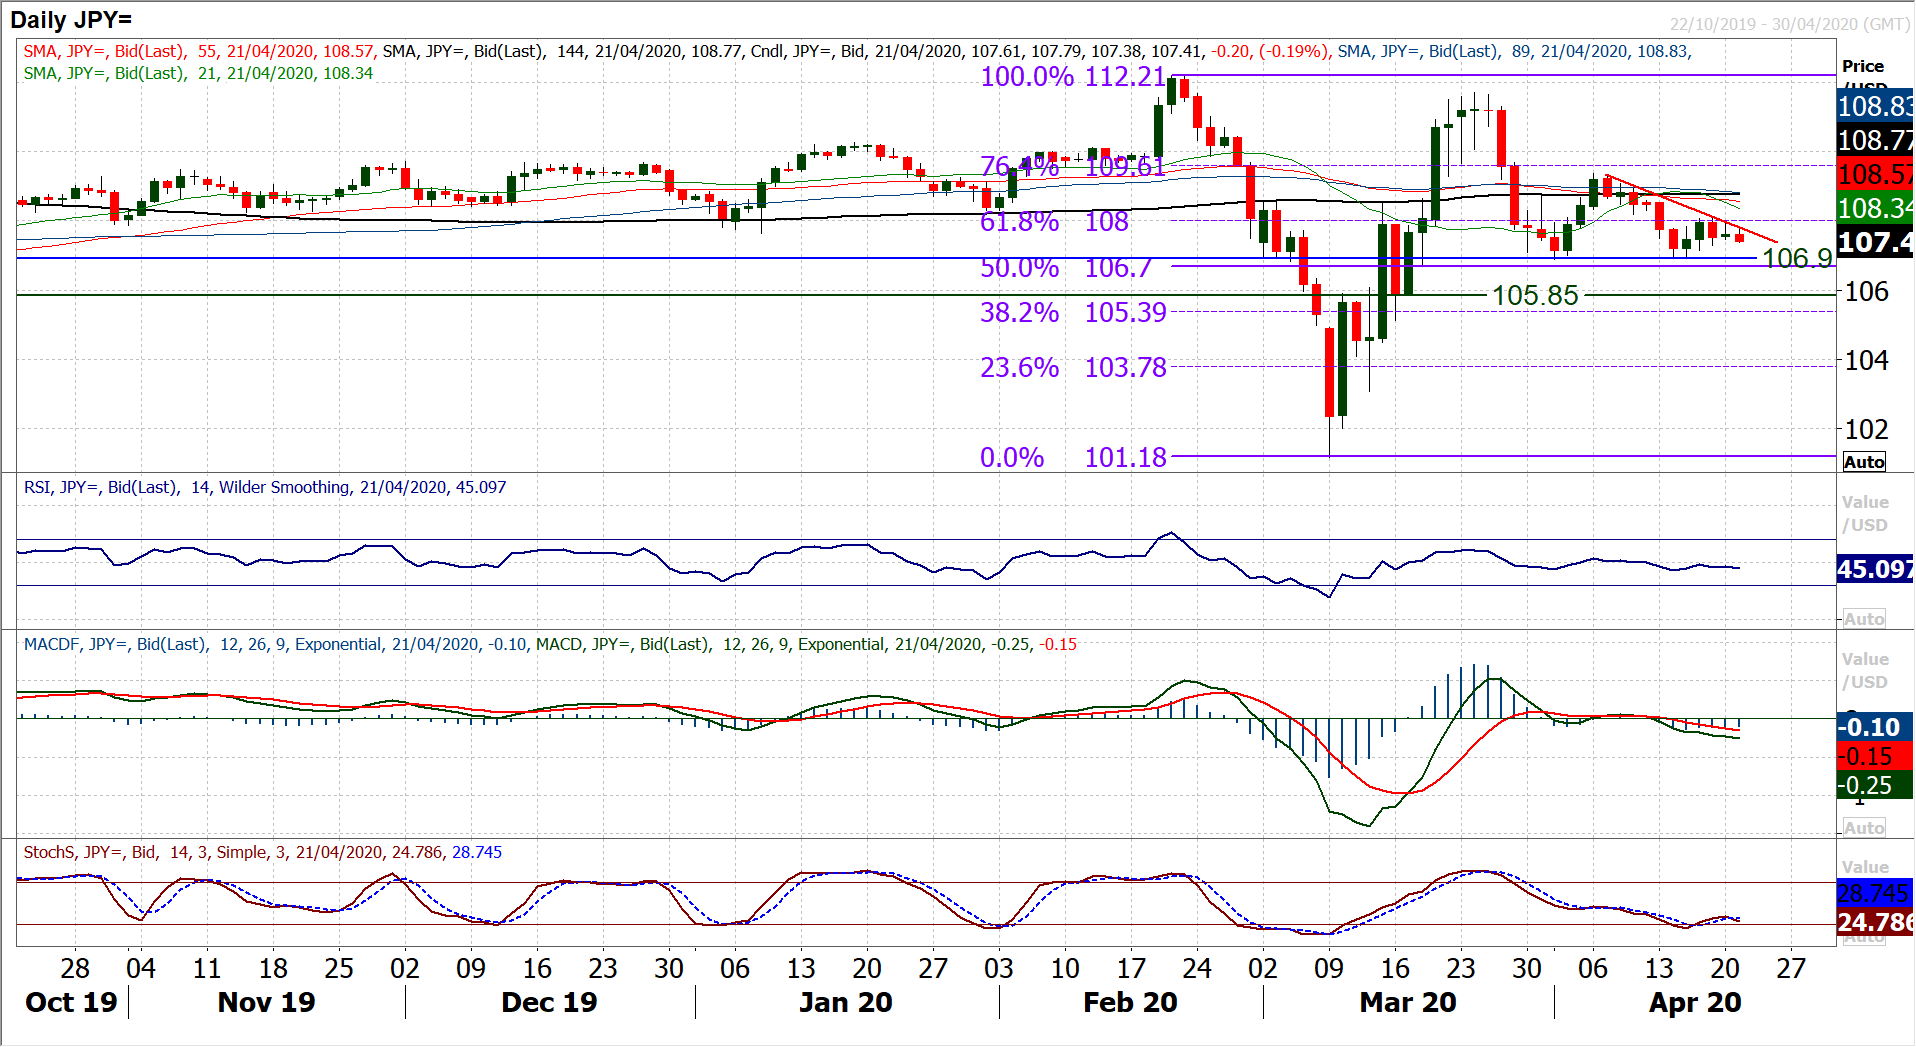
The dollar bulls had to endure another session yesterday stuck under the resistance band 108.00/108.20. However, risk appetite is edging negative once more, and even though this is broadly positive for the dollar, the primary safe haven play remains the yen. Subsequently, Dollar/Yen is drifting back lower once more. The mild negative bias continues, with the price trading under all moving averages (which are beginning to fall), whilst the shallow two week downtrend (falling today at 107.80) remains a basis of resistance. Momentum indicators are just beginning to edge tentatively negative once more and the suggestion is that little intraday rallies remain a chance to sell. Looking on the hourly chart, the signals are still fairly neutral, but testing lower. Hourly RSI having spent the past three sessions between 35/65 is drifting towards the lower bound, whilst MACD lines are tailing off again below neutral. There is little real aggression in this decline, Rallies towards 108.00/108.20 have been fading for over a week now, but support is also is also still holding at 106.90, 107.15 and 107.30. realistically the chart needs a breach of 106.90 for decisive direction lower, or above 108.60 for a bullish upside break of the consolidation. We favour the move lower although with little real conviction yet.
Gold
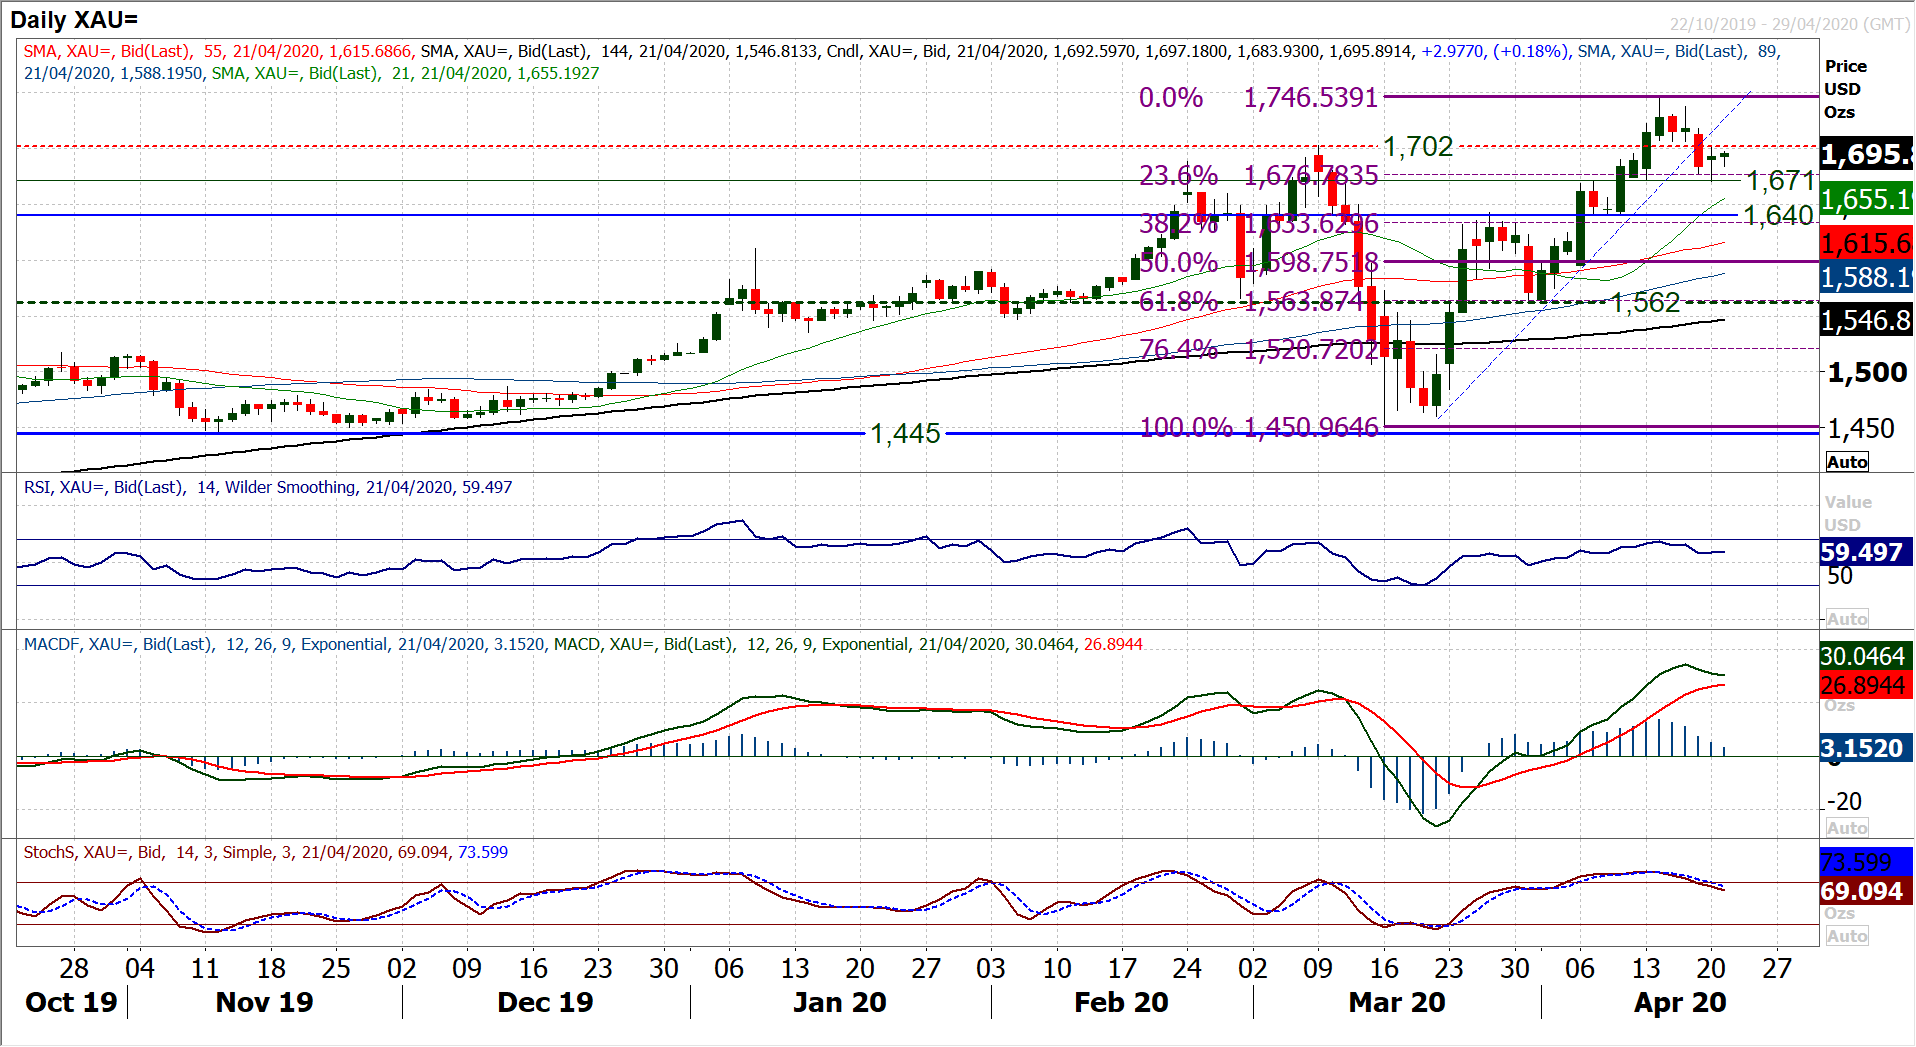
The corrective conditions are still in place on gold. The question is whether the move has played out in its entirety yet. We continue to view near term corrections as a chance to buy on gold. Looking back at the price action on previous moves lower on gold, during normal market conditions, the selling pressure has been limited before the buyers have moved to support. The only times where significant lurches lower have been seen have been when significant strain has hit through equities, with margin call related selling associated with gold. Unless this massive strain kicks in across equities, we see gold will retain its attraction as an outperformer in this market. So it was interesting to see gold bouncing off the old $1671 breakout yesterday. There is a small top pattern on the hourly chart which implies $1666/$1671 as a target area. SO this move may have already now played out. We need to see how gold begins to react now. Is weakness supported? Does momentum improve? The reaction around the $1702 neckline could be key. It was resistance yesterday, but if this is now breached, with improving momentum, then this is a sign that bulls are gaining strength once more. Hourly RSI consistently moving above 60 and hourly MACD consistently higher above neutral would be positive signals too. A failure under $1671 would defer this move, but the longer that $1671 holds, the more interested the bulls will become.
WTI Oil
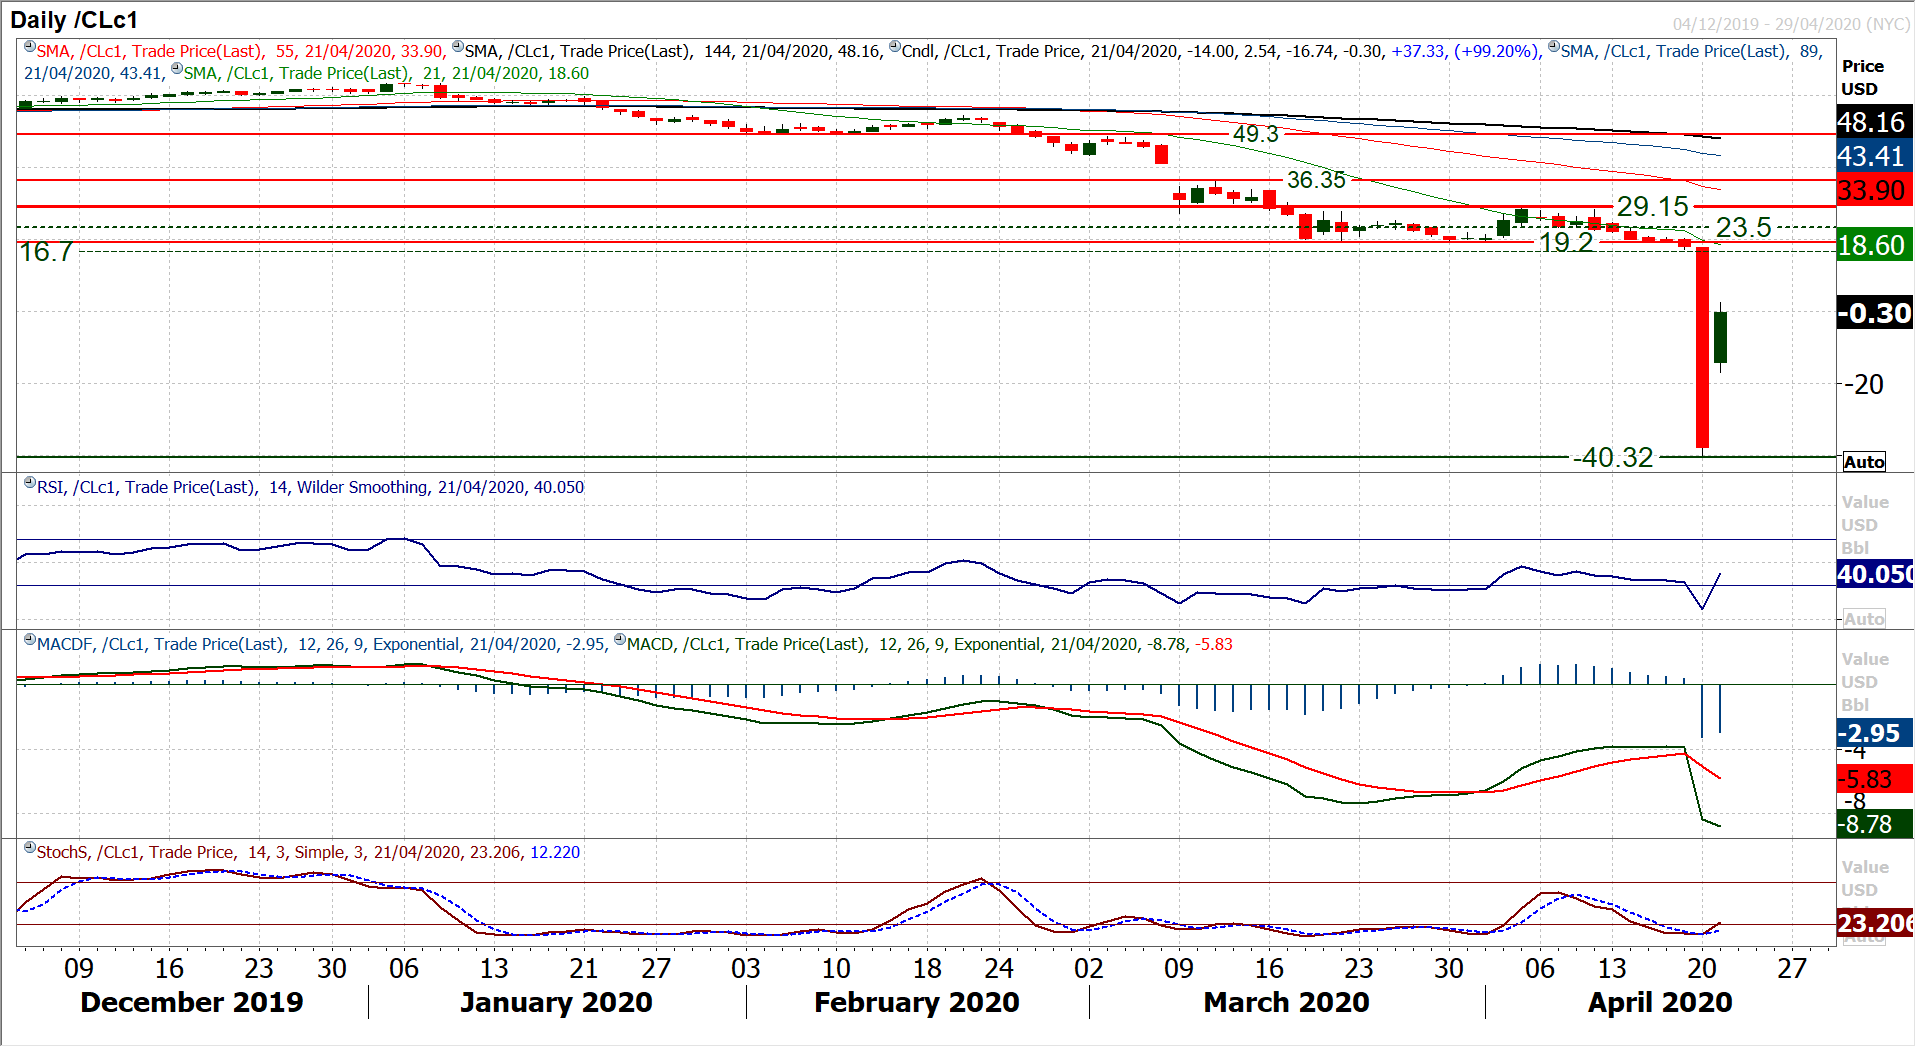
What a stunning chart! WTI went negative yesterday. No, that is not a typo, the WTI oil price fell into negative territory yesterday. At one stage the price was negative by over -$40, meaning traders were being paid to buy WTI oil. The issue is one of massive oversupply in the US, a lack of storage capacity and the expiry of the May futures contract. Because the oil price is a continuation chart, it take the front month price of the futures. This is currently the May contract which expires today and no one has wanted to buy May contracts and take physical delivery of oil that they cannot store. However, the rollover to the June contract will happen today and June is currently trading at over +$21, meaning that this time tomorrow, the continuation price will have gapped massively higher again. The question that traders don’t know yet is whether this massive sell-off to the front month contract will happen again next month when the June contract expires. It depends upon how long the lockdowns of major economies are in place and whether futures traders can see light at the end of the tunnel for oil demand. As for the WTI price today, it has rebounded, with the May contract returning to positive, however, there is no meaningful technical analysis you can give at this time.
Dow Jones Industrial Average
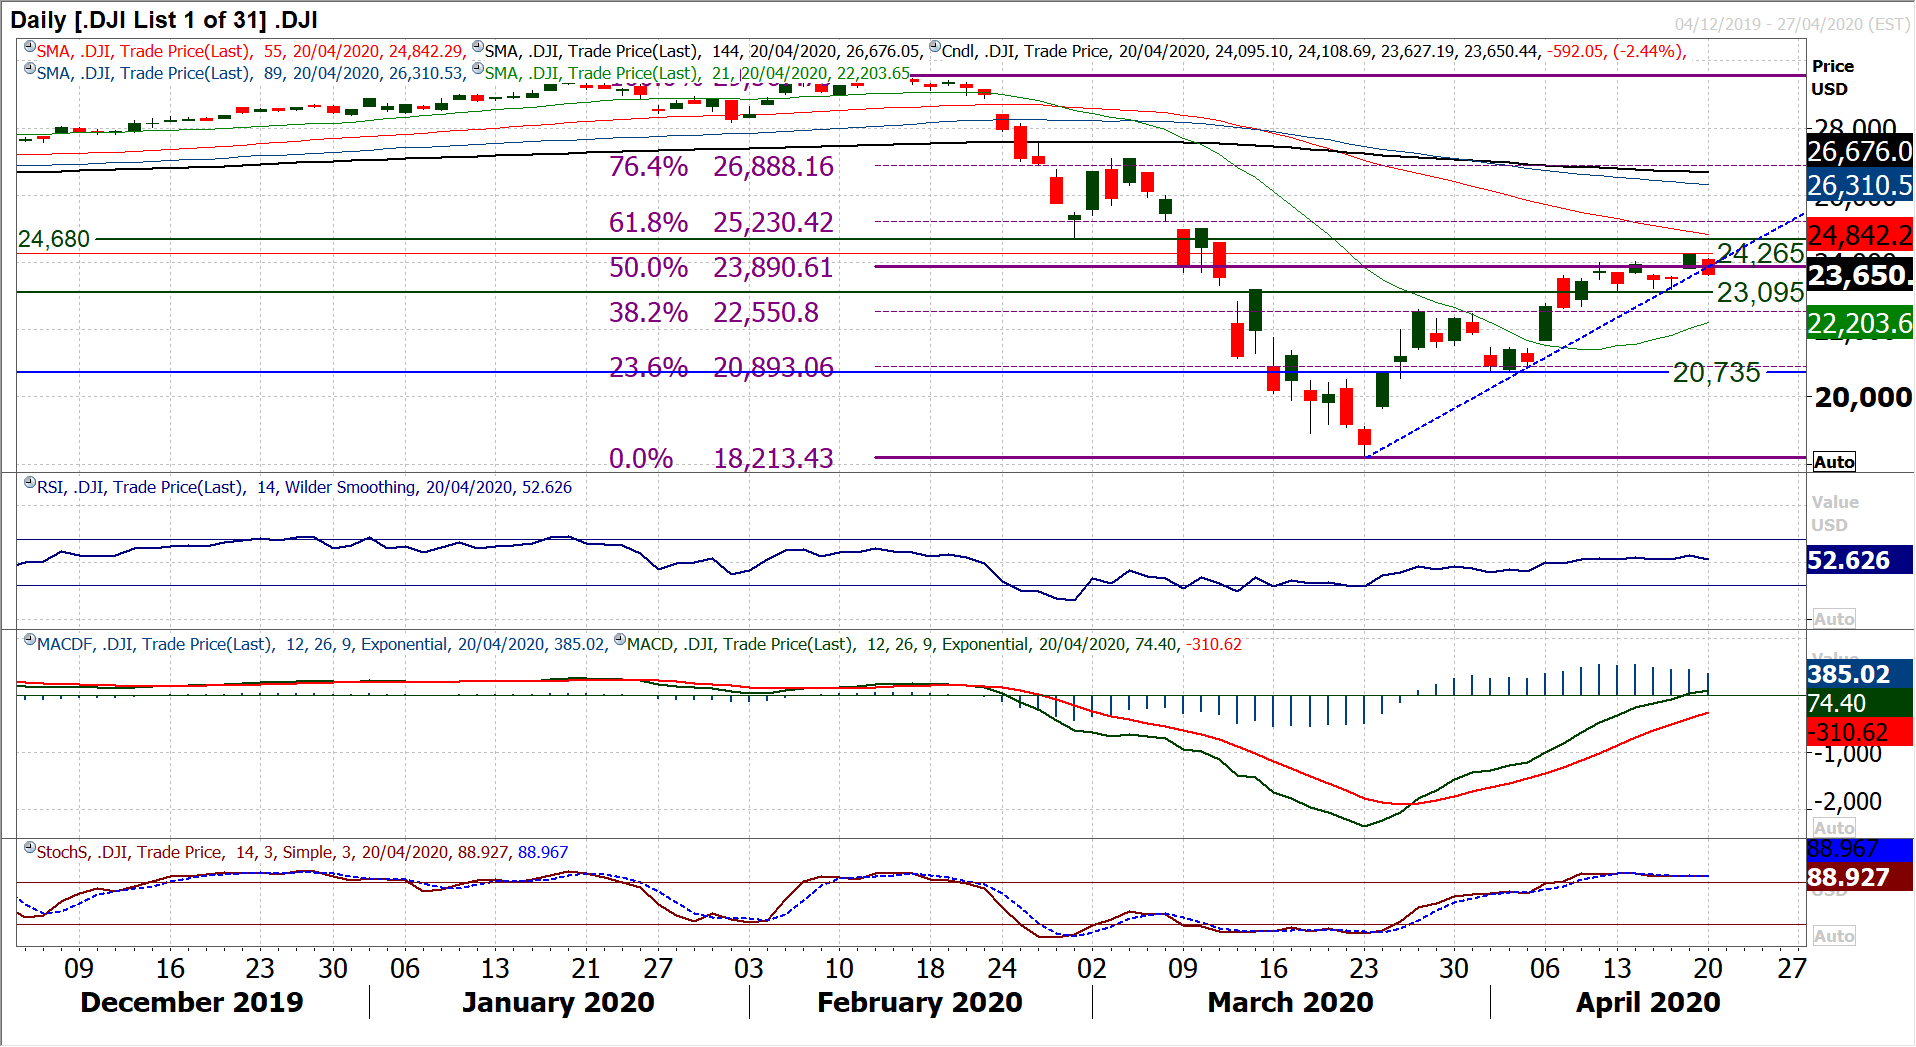
With risk aversion setting in once more, the Dow has had a negative start to the week. A bear candle has seen the market turn back to leave a multi-week high at 23,265 and the threat of a correction is growing. A four week uptrend has been broken by yesterday’s 2.4% sell-off. This is the first really negative signal on the Dow for a couple of weeks and means that how the market responds now could be crucial. Given the sharp trajectory of the uptrend, it was always going to struggle to hold, however, how the bulls respond to firstly the gap at 23,598 and then the key higher low at 23,095 will be even more important. “Closing” the gap today would be another negative signal., but a confirmed closing breach of support at 23,095 would be the first breach of a higher low and hint at a potential changing of trend. Trading clear below the 50% Fibonacci retracement (of 29,567/18,213) at 23,890 also opens 38.2% Fib at 22,550, which is in the middle of the old key breakout support at 23,480/23,595. This could be a key near to medium term turning point for the Dow.
