Market Overview
An absolute deluge of selling across anything of notable risk resulted in record levels of bearishness yesterday. It is far too early to say this morning, but as the elastic begins to snap back, have we seen “the” low? Given the Coronavirus is increasingly sweeping across major countries (Italy on broad shutdown now), the true impact has yet to be seen. Given the sheer weight of the unknown, it is impossible to say if this is “the” bottom yet, even if yesterday felt like a bit of a culmination in selling pressure. Volatility is just eye-watering right now though and is likely to remain elevated for some time to come. The VIX Index of S&P 500 options volatility reached 60 yesterday, levels not seen since the financial crisis of 2008. However, the word of the day could well be “stimulus”. Donald Trump will discuss potential payroll tax cuts with Congressional leaders. Fiscal stimulus has also been suggested by Japan too, whilst tomorrow’s UK Budget is also expected to offer some fiscal support. Subsequently, there seems to be some sense of relief rally this morning. US Treasury yields have rebounded, with the US 10 year yield +16 basis points, and with the strong correlation to the dollar, we see USD also rebounding across the board. Equities are also engaging in something of a relief rally, although at the moment it is small fry compared to the decline of yesterday. China inflation was broadly in line with expectations and does little to change the focus off Coronavirus and its associated impact.

Wall Street closed a mammoth negative session with the S&P 500 –7.6% lower at 2746. US futures are rebounding with gains of +2.7% early today and this has helped Asian markets higher, with the Nikkei +0.8% and Shanghai Composite +1.8%. In Europe, the DAX futures are +1.3% higher in early moves. In forex, the big rebound on USD is small in the context of recent selling, but at least it may be a start. JPY is the biggest underperformer today, whilst the commodity currencies are performing well (aside from versus the dollar). In commodities, gold is over -1% lower, with silver is +0.7%. Oil volatility remains significant in a rebound of +5%.
It is another rather quiet day on the economic calendar. The final reading of Q4 Eurozone GDP (Revised) is at 1000GMT which is expected to be left unchanged from the +0.1% of the second reading.
There will be focus on any central bank speakers at the moment. Nothing from the Fed with the FOMC members in blackout period, but the RBA’s Deputy Governor Guy Debelle is speaking at 2200GMT and we may get a steer for the RBA’s next move.
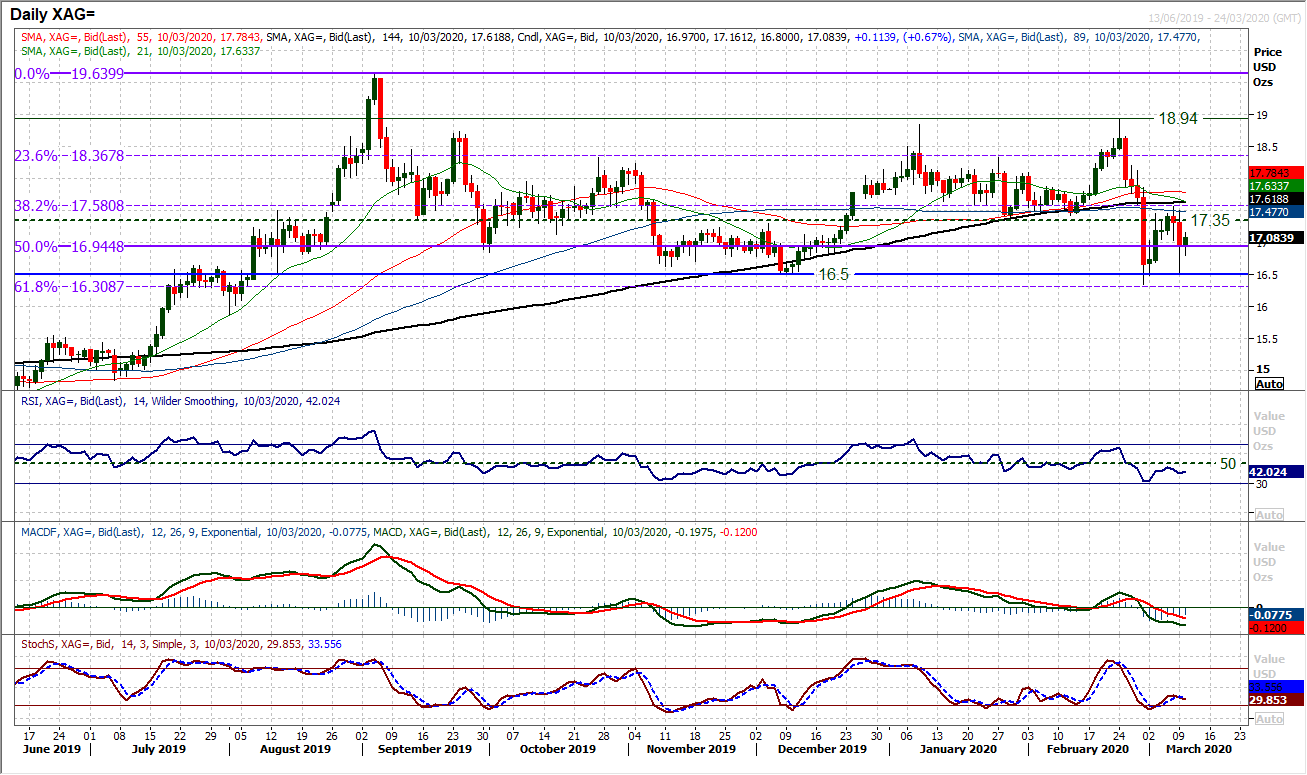
Chart of the Day – Silver
A hugely volatile session yesterday across major markets saw selling pressure on silver. Although, being an industrial precious metal, silver has financial components that leave it (relatively) balanced during these turbulent times. As such, the market remains in a medium term trading range, even if there is a mild negative bias within that range. Whilst support at $16.50 holds, the bears will be kept at bay. Yesterday’s intraday support holding at $16.50 is encouraging and there is again an appetite to support today at $16.80. However, the recent failure around the mid-range pivot at $17.20/$17.35 leaves the market with resistance to overcome at $17.57, interestingly around the 38.2% Fibonacci retracement (of the $14.25/$19.64 bull run) at $17.58. With momentum indicators still sliding back under their neutral points this still points to mild sell positions around the pivot area, but with short term time horizons. With market fears remaining elevated we expect the pressure to continue on $16.50 but the range to continue.
EUR/USD
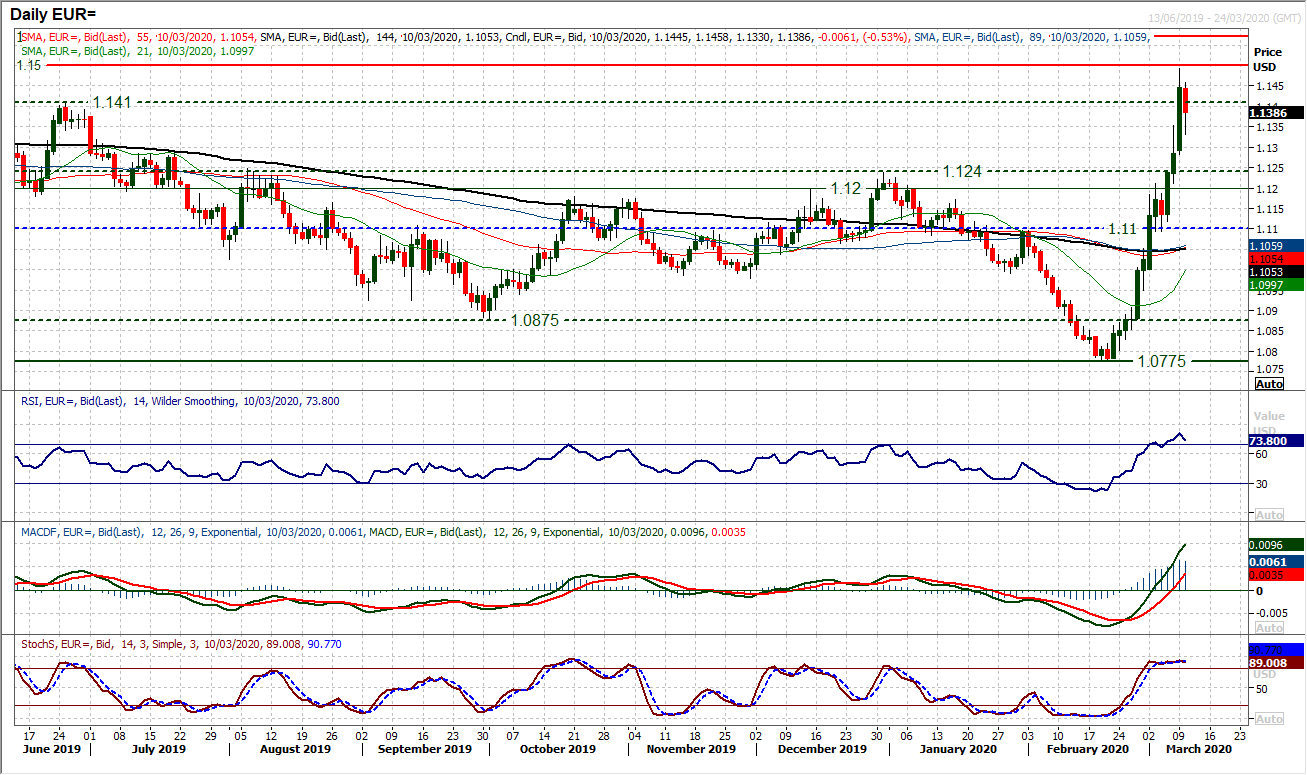
Given the huge bull run on the euro, some sort of counter-reaction is not a big surprise. Turning back from $1.1492 at yesterday’s high, the early profit-taking today is forming a substantial negative candle. The question is, whether this is the start of something meaningful from the dollar bulls. Technically, the first reversal signal could be the RSI closing back under 70 (classic RSI bear cross), but given that we saw this a week ago, there needs to be a move at least into the low 60s, or even sub-60 to really suggest a firm reaction. A bear cross on Stochastics too would be added confirmation. A look on the hourly chart shows there is a pullback in process, but a decisive move below $1.1350 is the first trigger, whilst a breach of $1.1285 would be confirmation of something deeper. Then the pullback would be eyeing the breakout support band $1.1200/$1.1240. The hourly chart shows $1.1410 developing into a potential lower high this morning.
GBP/USD
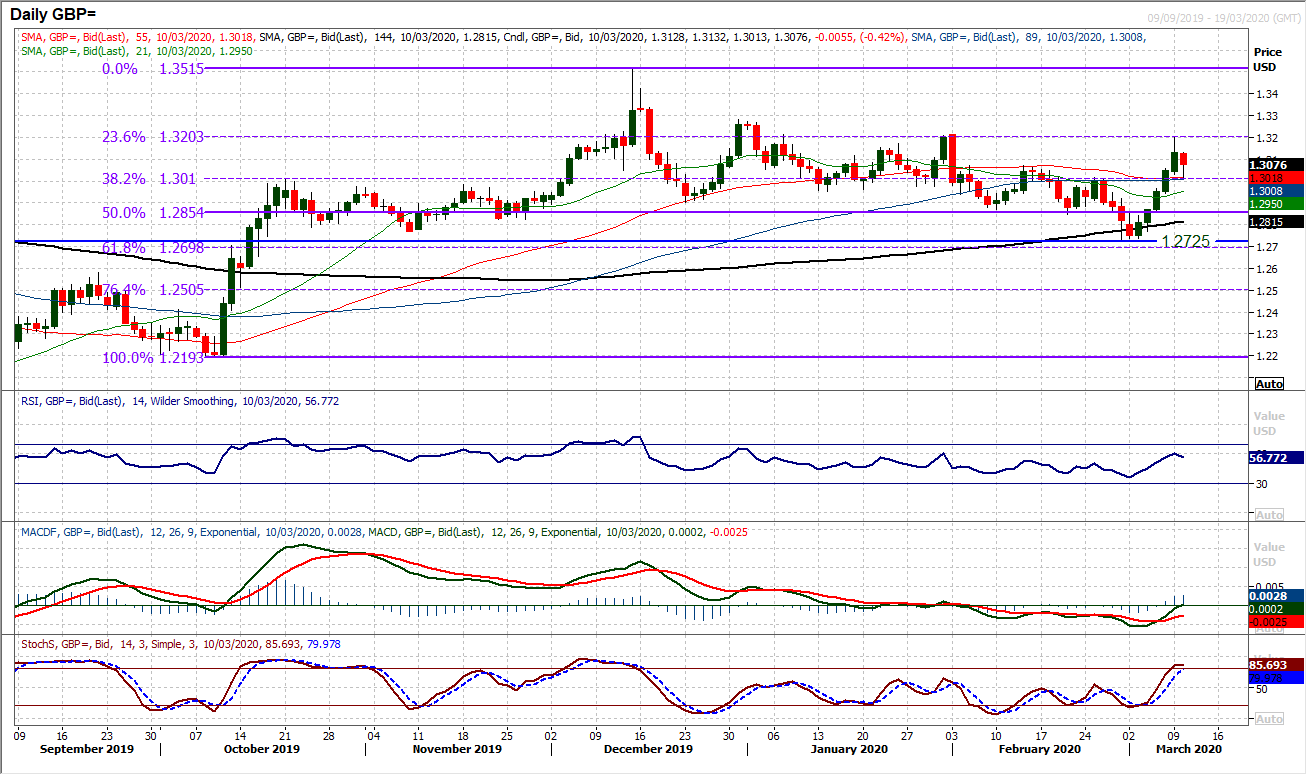
Sterling has posted another positive candle as the market has pulled higher, but resistance around $1.3200 remains intact to leave the medium term range intact. However, this near term bias is turning on its head again this morning and another retracement move is growing with force. How the bulls react to the support around $1.3070 will be key. This was the latest breakout, but already this morning, the bulls have breached the support. Give the decisive recent rebound, the medium term outlook is far more neutral now. It is interesting to see the RSI failing at 60 with the late January rally, and failing at 60 again with this rally. Sterling does not seem strong enough to breakout (at least not unless the US dollar has another massive dump). Continue to play the range. Closing under the nest breakout at $1.3015 and the 38.2% Fibonacci retracement (at $1.3010) opens the 50% Fib at $1.2855 again. These Fib levels have been an excellent gauge for Cable in recent months.
USD/JPY
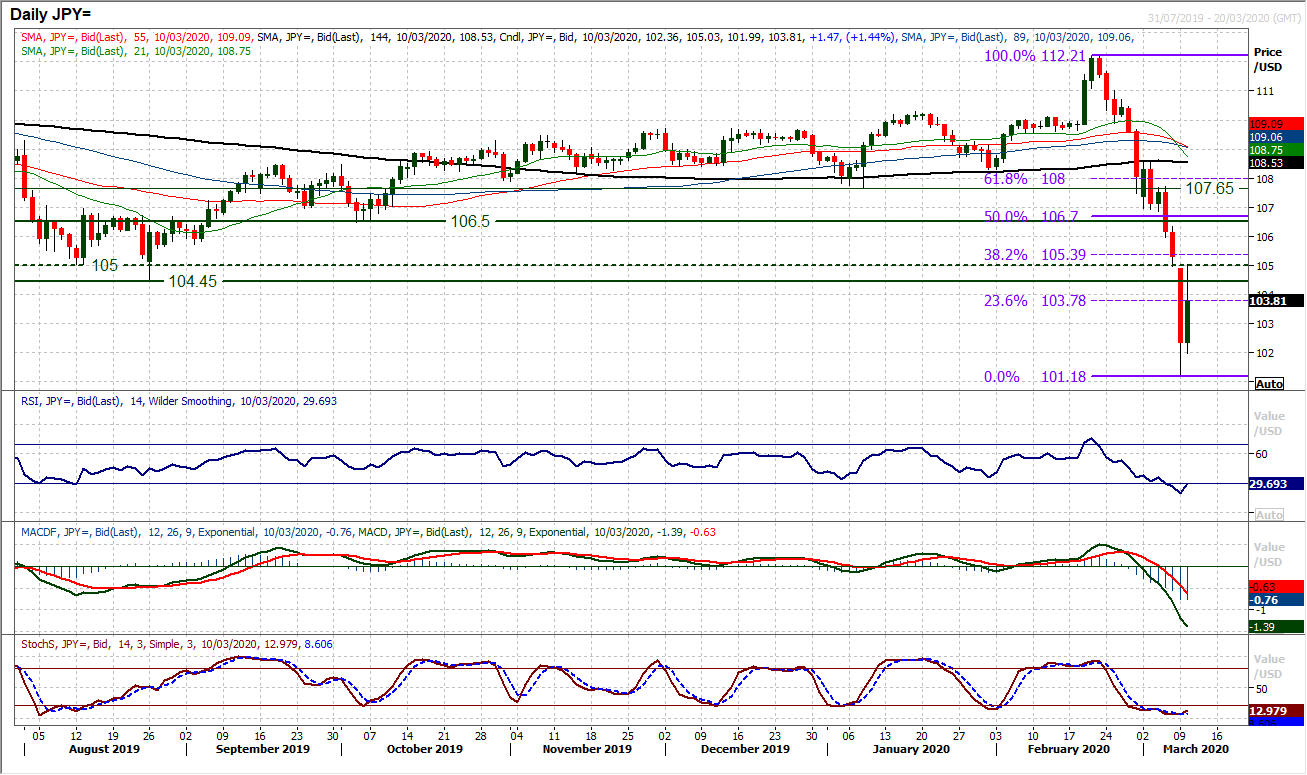
With US Treasury yields rebounding strongly today (there is a strong positive correlation with USD/JPY) the Dollar/Yen rebound has set in. On the way down, this pair was the most sensitive to dollar selling, so we would expect a retracement move to be equally as reactive. So, this overnight huge rally has set in and is already back around 104.50/105.00 which is an area of significance, being old key lows and now resistance. It is interesting to see the gap from 105.00 of yesterday’s move, having now been filled early today. The bulls need to “close” this gap (have the closing price above 105.00) to suggest there is any substance to a rebound. Daily momentum indicators are reacting higher, with RSI above 30 being the first notable mover. Stochastics are also beginning to tick higher (not a confirmed bull cross yet). The hourly chart shows this is at least becoming a decent effort from the bulls overnight, with good momentum forming into the European session today. Above 105.75 would be another marker for the bulls to reach. Initial support at 103.00/103.65.
Gold
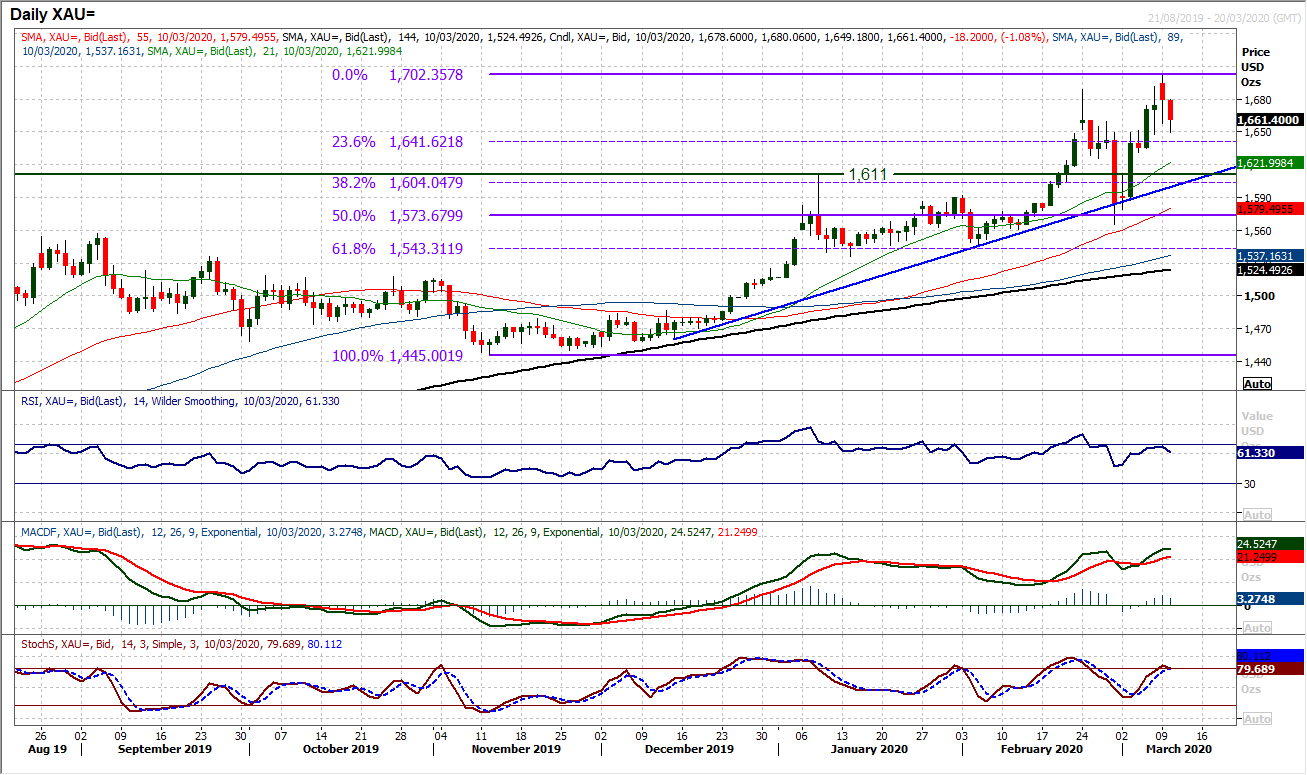
On a day where volatility reached levels not seen for years and fear gauges went through the roof, gold posted a negative candle. Whilst the close was higher, this move raised a few eyebrows. The uncertainty levels over the strength of the bulls grew more overnight as gold has started to pull back. We began to look into the prospect of a small reversal pattern on the hourly chart yesterday, this pattern has completed overnight. A small head and shoulders top below $1660 (an old resistance) suggests that there could now be a retracement in the offing. A corrective move of around $40 is the implied target. This would leave gold around $1620, just above the old $1611 breakout. There are little retracement signals building on the daily momentum, with Stochastics threatening to cross lower and RSI already rolling over. This would still be just a near term pullback and we would view it as another chance to buy on a medium term basis. The three month uptrend comes in around $1600 today. With the recalculation of the Fibonacci retracements (of the now $1445/$1702 rally) we see $1641 as the first gauge of support, being the 23.6% Fibonacci retracement. To hang on to their gains, the bulls need to pull back above $1680/$1685 resistance built throughout yesterday’s session.
WTI Oil
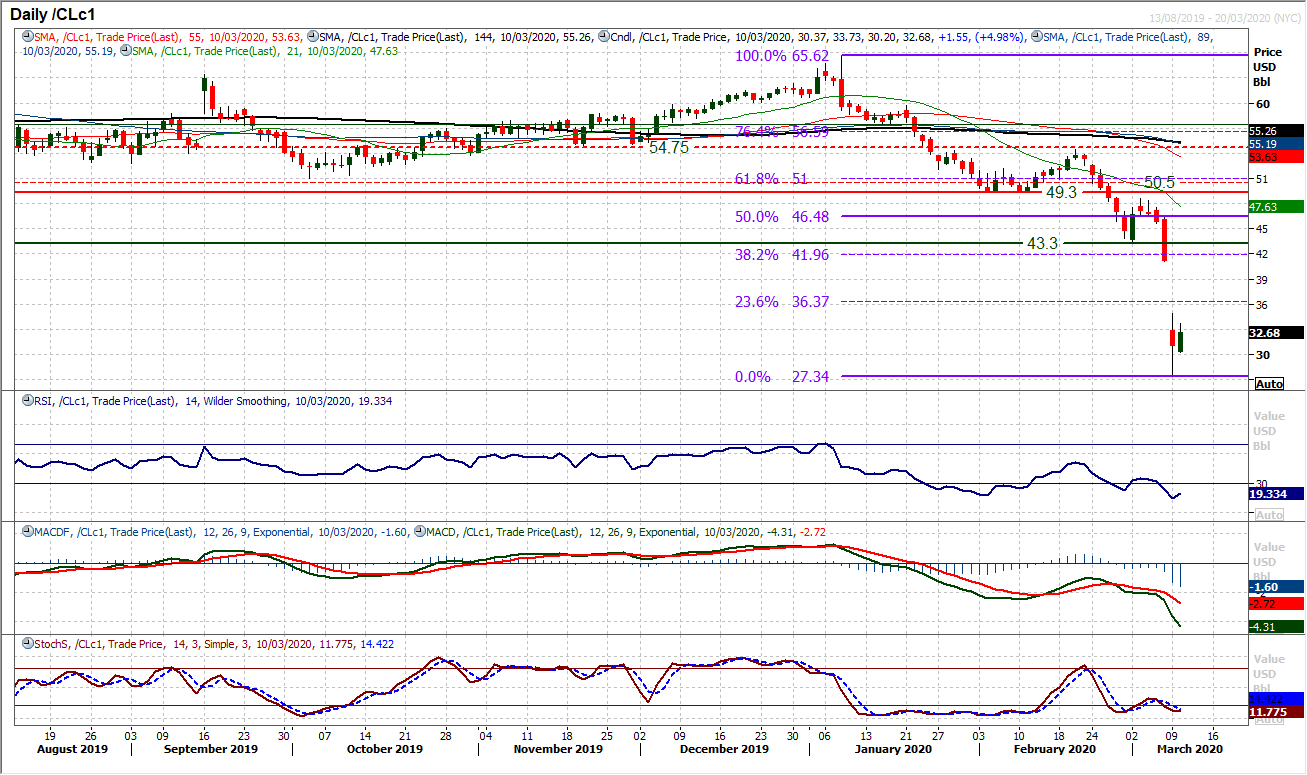
The incredible sell-off on oil yesterday has left a cavernous gap open at $41.05, but with the market so incredibly oversold, the volatility is enormous for how the bulls go about trying to recover the lost ground. Over +7% higher today does not even look like much on the chart. It has also barely scratched the surface of technical recovery signals. The hourly chart may be more helpful and there is mid-session resistance at $34.90 from yesterday which the bulls will be looking to overcome as a first real step forward. Furthermore, $30.15 is a higher low to note above the $27.35 traded low from yesterday. Given how oil has reacted in a rebound this morning, the volatility will be the biggest hurdle preventing any semblance of a smooth recovery. The dust is yet to settle but some positive candles would now be a start.
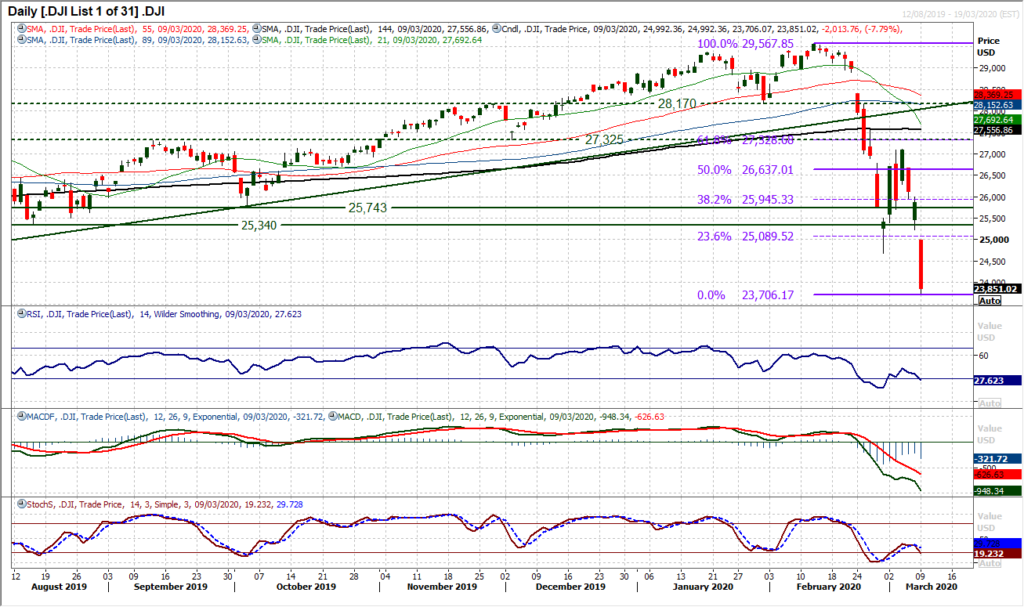
Dow Jones Industrial Average
Pick the bones out of that one! It was absolute carnage on Wall Street yesterday, with the Dow closing over -2000 ticks lower in the fourth largest ever points decline. The market closed around 14 month lows and traders are on their knees. Where to go from here. Well, the first thing to say is that futures are pointing higher, currently strongly higher. But still, whilst 23,706 might be a low, there is little real confidence that this is “the” low. Volatility is huge and will likely remain elevated for some weeks. Technically the market is negative on momentum, but not even overly stretched. Perhaps some positive divergences could begin to form, but let’s see where the dust begins to settle in the coming days. For now, notable marker points for a recovery to break through are the old February low of 24,680 and yesterday’s gap down at 25,227. Closing the gap would be a useful start for the bulls, but the road to recovery is long from here.
