Market Overview
Central banks and governments are coming out with measures to mitigate the economic impact of the Coronavirus. The commitment for ever easier monetary policy was cranked up several notches by the Federal Reserve yesterday on a pledge to expand its balance sheet as much as is necessary (rather than its previous commitment for a set amount of additional asset purchases). Countries of the EU now allowed to spend whatever they like too, as the conditions of the Stability and Growth Pact have been eased. Sentiment has turned more positive this morning, but the final signal that the market may need to develop meaningful support will be the US Congress agreeing on a package of fiscal support. For now at least, equity futures are higher, commodity prices are recovering and the strength of the US dollar is dissipating. These all need continue to move in this direction for confidence to build. With US Treasury yields plunging back (on the enormity of the potential Fed easing) this has weighed on the dollar, but yields are fairly steady today. How the dollar responds to this will be key. It is weakening still this morning, and if yields are steady as the dollar falls further, this should be seen as a positive sign for broader markets.

Wall Street lurched another leg lower last night with the S&P 500 -2.9% into the close (to 2237) but US futures are strongly higher today (+4.3% currently). Asian markets were strong in response overnight, with Nikkei +7.1% and Shanghai Composite +2.3%. In Europe a similar positive response with FTSE futures +4.5% and DAX futures +5.5%. In forex the USD weakness is the main mover, with a risk positive bias to the majors. The AUD and NZD are the main outperformers, with EUR and GBP also performing well. CHF and JPY are performing less well in their rallies against the dollar. In commodities, the sharp rebound on silver (+3%) is also dragging gold higher (+1%), whilst oil is the big beneficiary over +4% higher.
The flash PMIs for March will be a crucial early snapshot of how the Coronavirus is impacting across major economies. Eurozone data is at 0900GMT and is expected to show economic growth indicators falling off a cliff. The Eurozone flash Manufacturing PMI is expected to drop alarmingly to 39.0 (from 49.2 in February. The flash Eurozone Services PMI is expected to be just as bad, at 39.0 way down from the 52.6 of February. This would all add up to the flash Eurozone Composite PMI dropping back to 38.8 (down from 51.6 in February). March data for the UK at 0930GMT is expected to show performance also cratering, with Flash UK Manufacturing PMI expected to drop to 45.0 from 51.7 in February. Flash UK Services PMI is expected to also plummet to 45.0 from 53.2 in February, meaning the Flash UK Composite PMI is expected to drop to 45.1 from 53.0 in March. Into the afternoon we get a gauge of how the US is performing at 1345GMT with the flash US Manufacturing PMI which is expected to drop sharply to 42.8, down from 50.7 in February. The flash US Services PMI is expected to fall back to 42.0 (from 49.4). Given the alarming deterioration in the regional Fed surveys, the risk will certainly be for a downside surprise. US Hew Home Sales are at 1400GMT which is expected to show 750,000 units in February (down from 764,000 in January).
There are no central bankers expected to speak today.
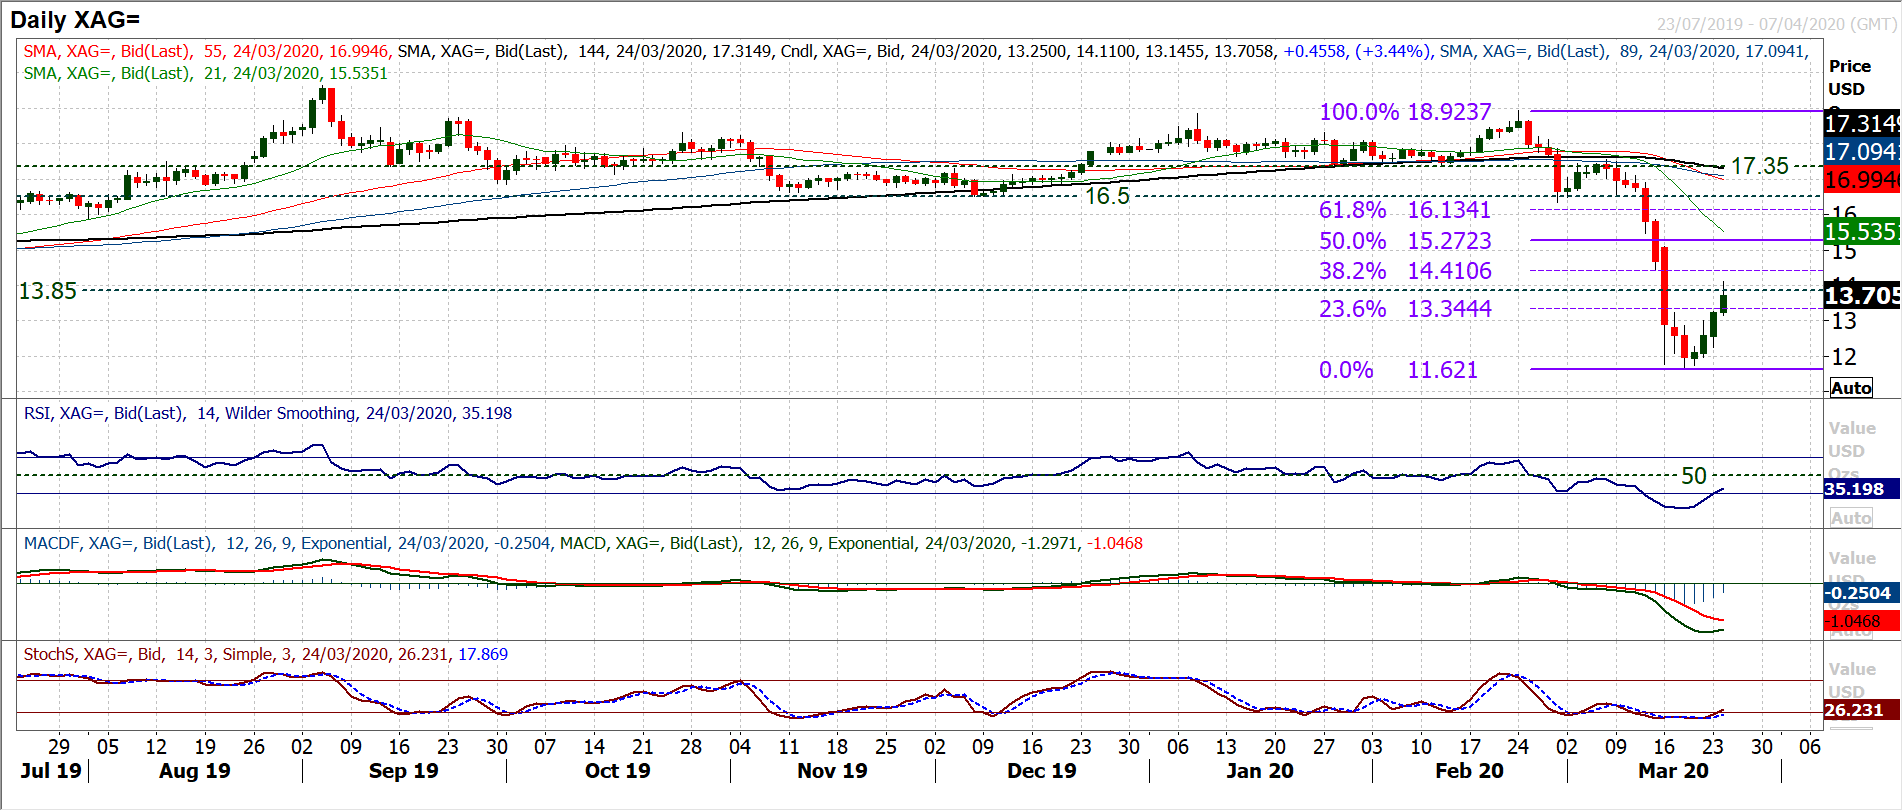
Chart of the Day – Silver
Silver got absolutely panned in the course of the past couple of weeks, however with three positive candles in the past three sessions, is this a serious recovery building? The precipitous decline started to dissipate in the early part of last week, with the market making a new low at $11.62. The daily chart shows an improvement with the price picking up and RSI crossing back above 30 (a basic buy signal) and Stochastics also bull crossing. Last week saw the RSI hit a closing level of 12, the lowest ever recorded so this looks to be a decisive recovery now. However, it is the hourly chart which really shows improvement in momentum configuration (hourly RSI consistently above 40 and pushing above 70, whilst MACD is solid above neutral). Resistance in the band $13.00/$13.25 had been a barrier for the past week but this has been overcome overnight. This completes a breakout to imply c. $15.00 of recovery target. With the market so fast moving on the way down, a recovery could also be fast through the little real resistance until $15.10. For the prospect of recovery to be sustained, the bulls will be looking to use $13.00/$13.25 as a news basis of support, something which is already showing overnight. Initial overnight resistance is at $14.10.
EUR/USD
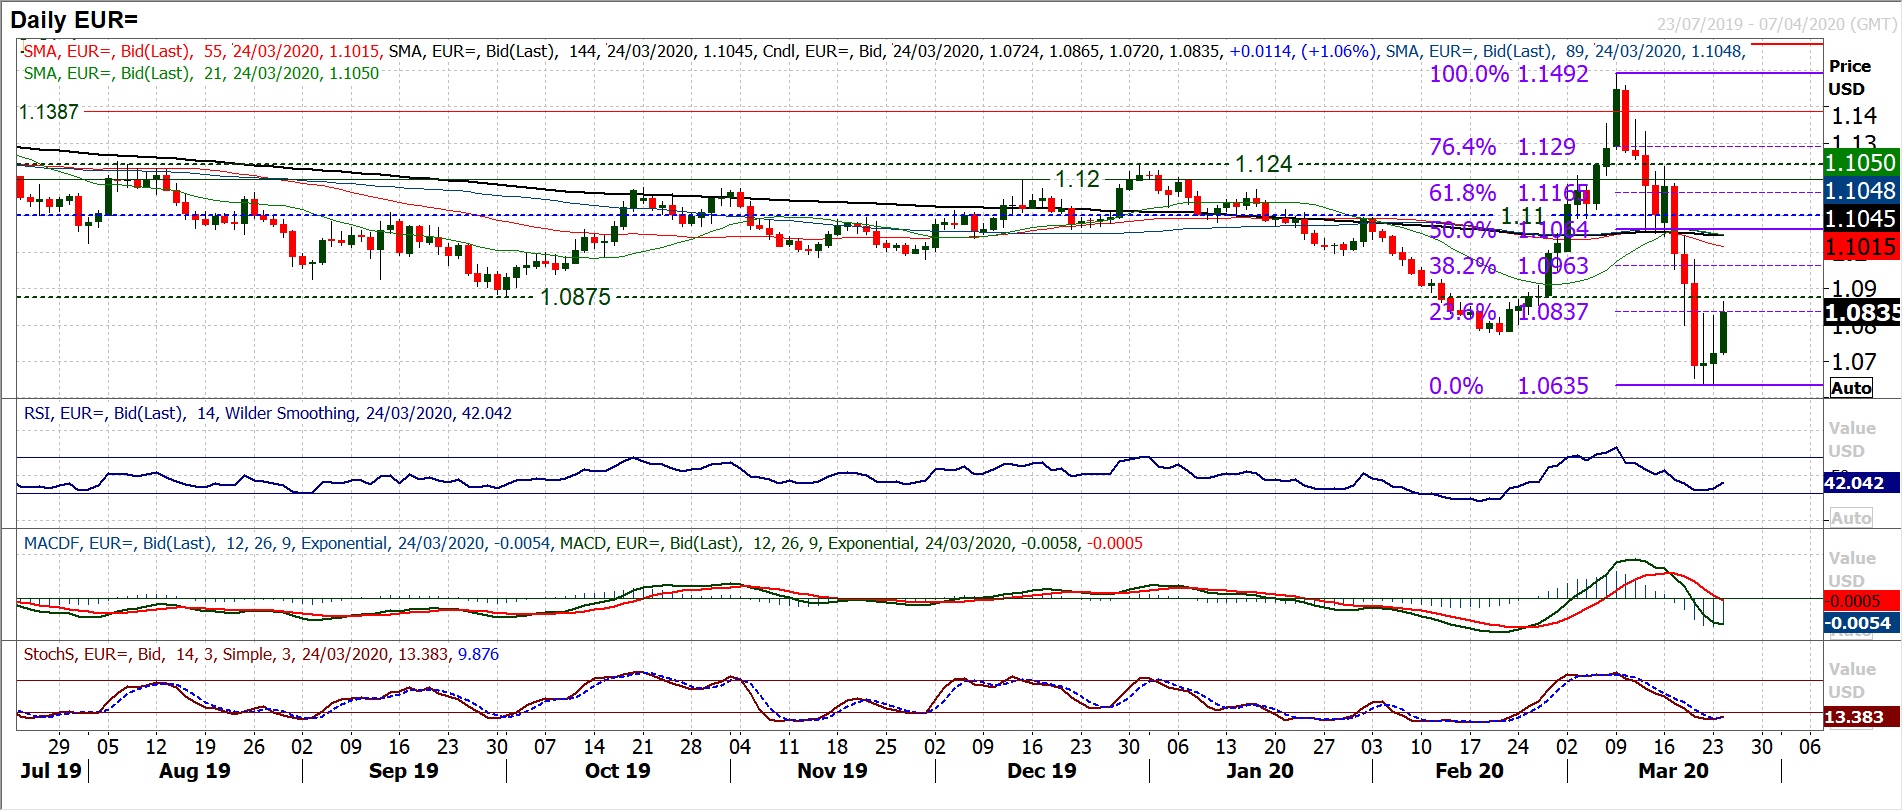
Whilst the market remains volatile (yesterday’s range of 190 pips was almost bang on the massively broad Average True Range of 194 pips), at least the euro bulls can be said to be fighting against the selling pressure. The past three daily lows have all come within 20 pips of one another, leaving yesterday’s low at $1.0635 as a level to keep an eye on now. A positive close in yesterday’s session also suggests that the bulls are trying to fight back. The hourly chart looks more constructive too and a base pattern is threatening. The resistance to overcome now is at $1.0830. This has been the daily high of the past two sessions and above here would complete a base pattern of around +195 pips of implied recovery target. Hourly RSI is building above 40 now and MACD lines are looking to push above neutral. Furthermore, the hourly RSI pulling consistently above 60 would be a positive sign as would MACD lines consistently above neutral. The 23.6% Fibonacci retracement (of the $1.1492/$1.0635 sell-off) comes in at $10837 and adds extra importance to the breakout above $1.0830 resistance. Above here, the hourly chart shows resistance around $1.0950 and then $1.1050.
GBP/USD
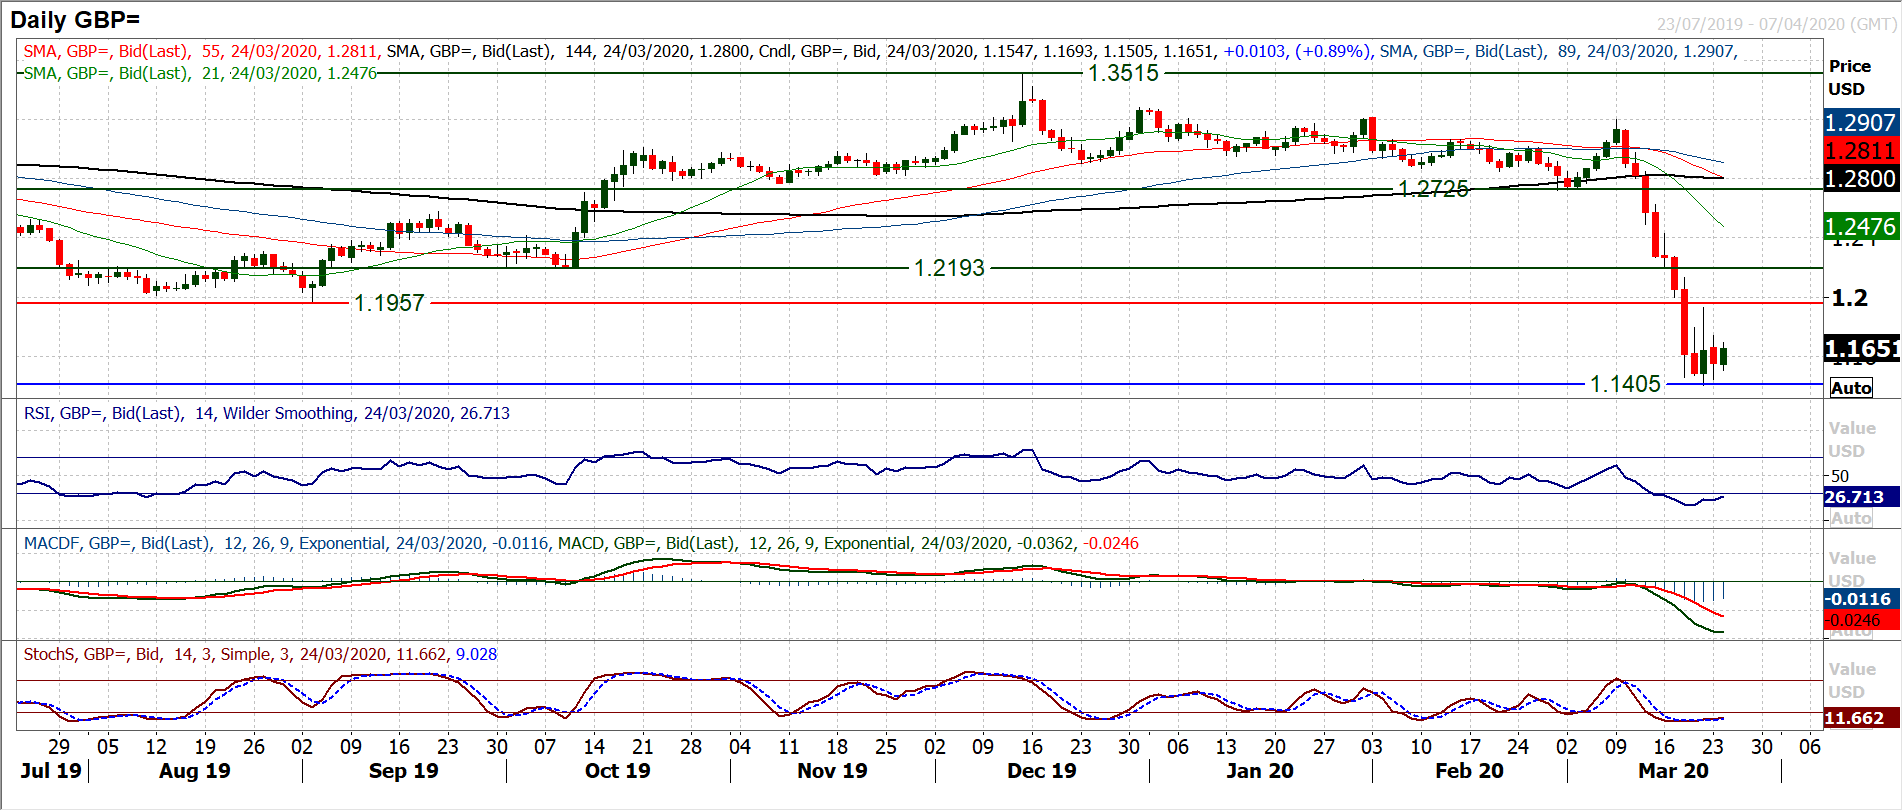
Has the selling pressure begun to subside? Last Friday’s low at $1.1405 has remained intact (a multi-decade low) during yesterday’s session and with Cable over +100 pips higher today, there are tentative signs of support. RSI is picking up (from 17 which was also the low of October 2016) whilst Stochastics are steadying too. There is more evidence of hope on the hourly chart, where the 7 day downtrend has been broken (and is now becoming a basis of resistance). Also the hourly RSI is now beginning to consistently hold on to 40, which suggests at least consolidation, for now. Initial resistance for today is $1.1700/$1.1740 but the main level to watch is $1.1930 as a break above here would be formation of a near term base pattern. The Average True Range remains wild at 289 pips (once more even yesterday’s more relatively settled session beat that) so given that today’s range is “just” c. 190 pips, we can expect more volatility as the session goes on. Support at today’s low of $1.1445.
USD/JPY
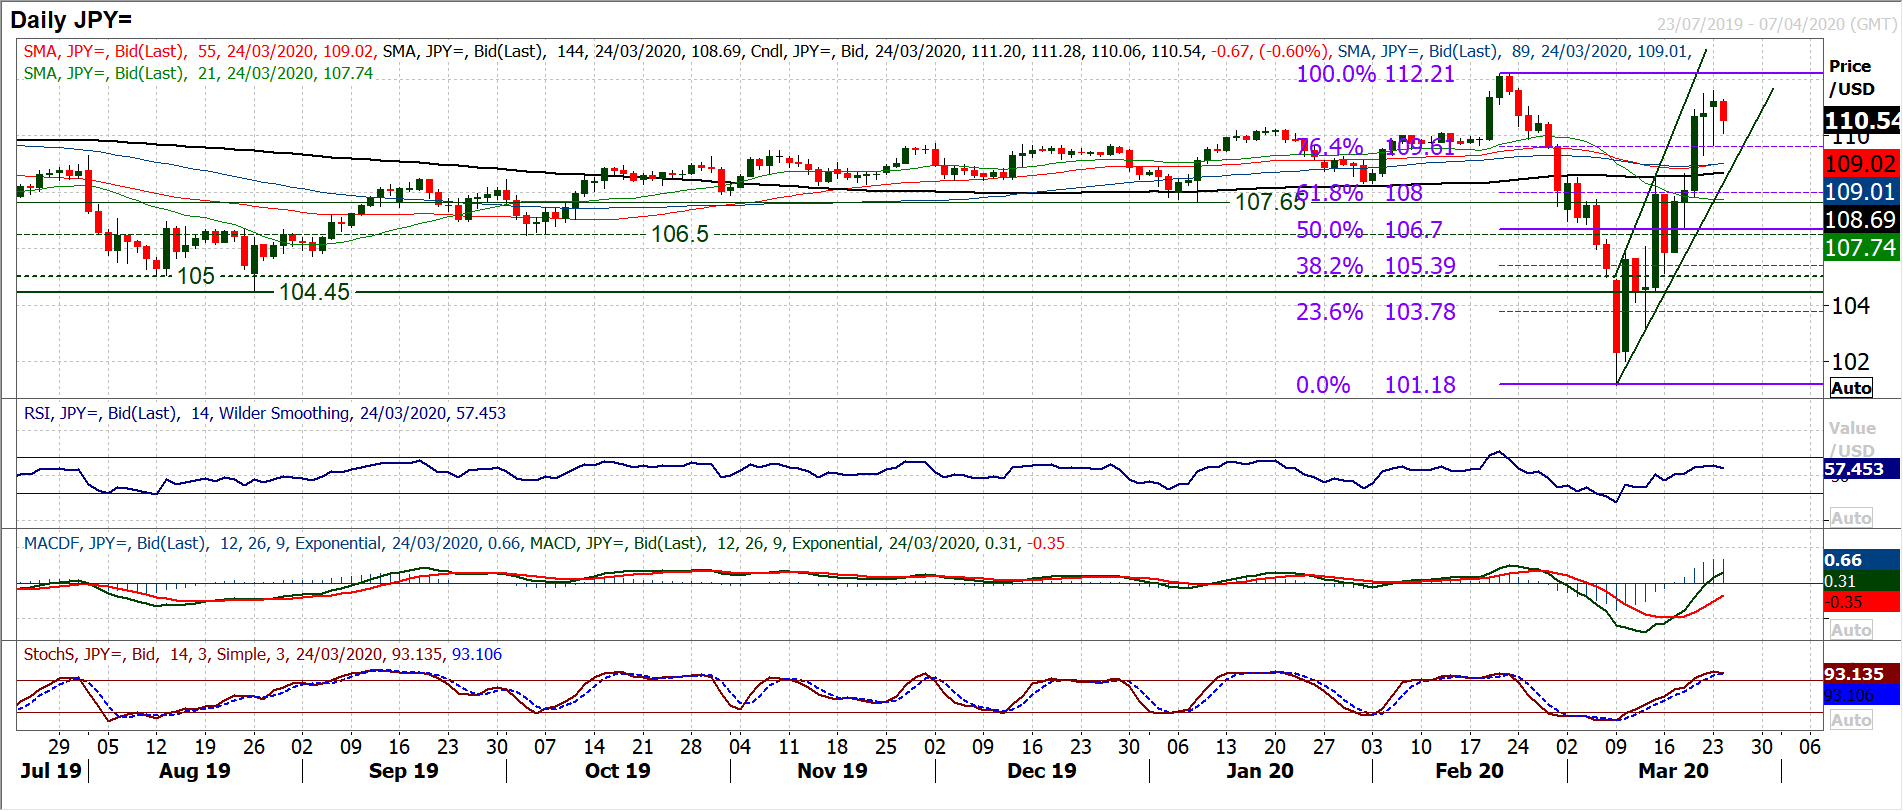
The sharp uptrend channel of the past two weeks has continued higher and is now within touching distance of the key February high of 112.20. However, the pace of the run higher has just begun to dissipate slightly in the past couple of sessions, with only marginal positive closes, but also including long lower shadows on the candlesticks. Coming into the European session., the early decline is also playing into this. The long lower shadows of the past two sessions are warnings that the sellers (profit-takers) are threatening to mobilize, but cannot quite get their ducks in a row yet. It will be interesting to see how the Europeans respond to this early decline. A failure to buy into the weakness could suggest that the bull run is waning. We have mentioned the consistent use of the Fibonacci retracements (of 112.20/101.20) on numerous occasions during the two week bull run. Once more, this was seen in yesterday’s session, where the 76.4% Fib (at 109.60) became a basis of support (for yesterday’s low at 109.65). This level takes on added importance now, were it to be broken (especially on a closing basis) as it complete a small top pattern on the hourly chart (that would be confirmed below support at 109.30. It is interesting to see RSI just beginning to roll over this morning, back under 60, whilst Stochastics are also beginning to tick over. Resistance has been left initially at 111.60 under the key 112.20 February high. There are marginal negative divergences developing on hourly RSI and hourly MACD. Hourly RSI under 40 and hourly MACD under neutral would suggest development of a corrective move.
Gold
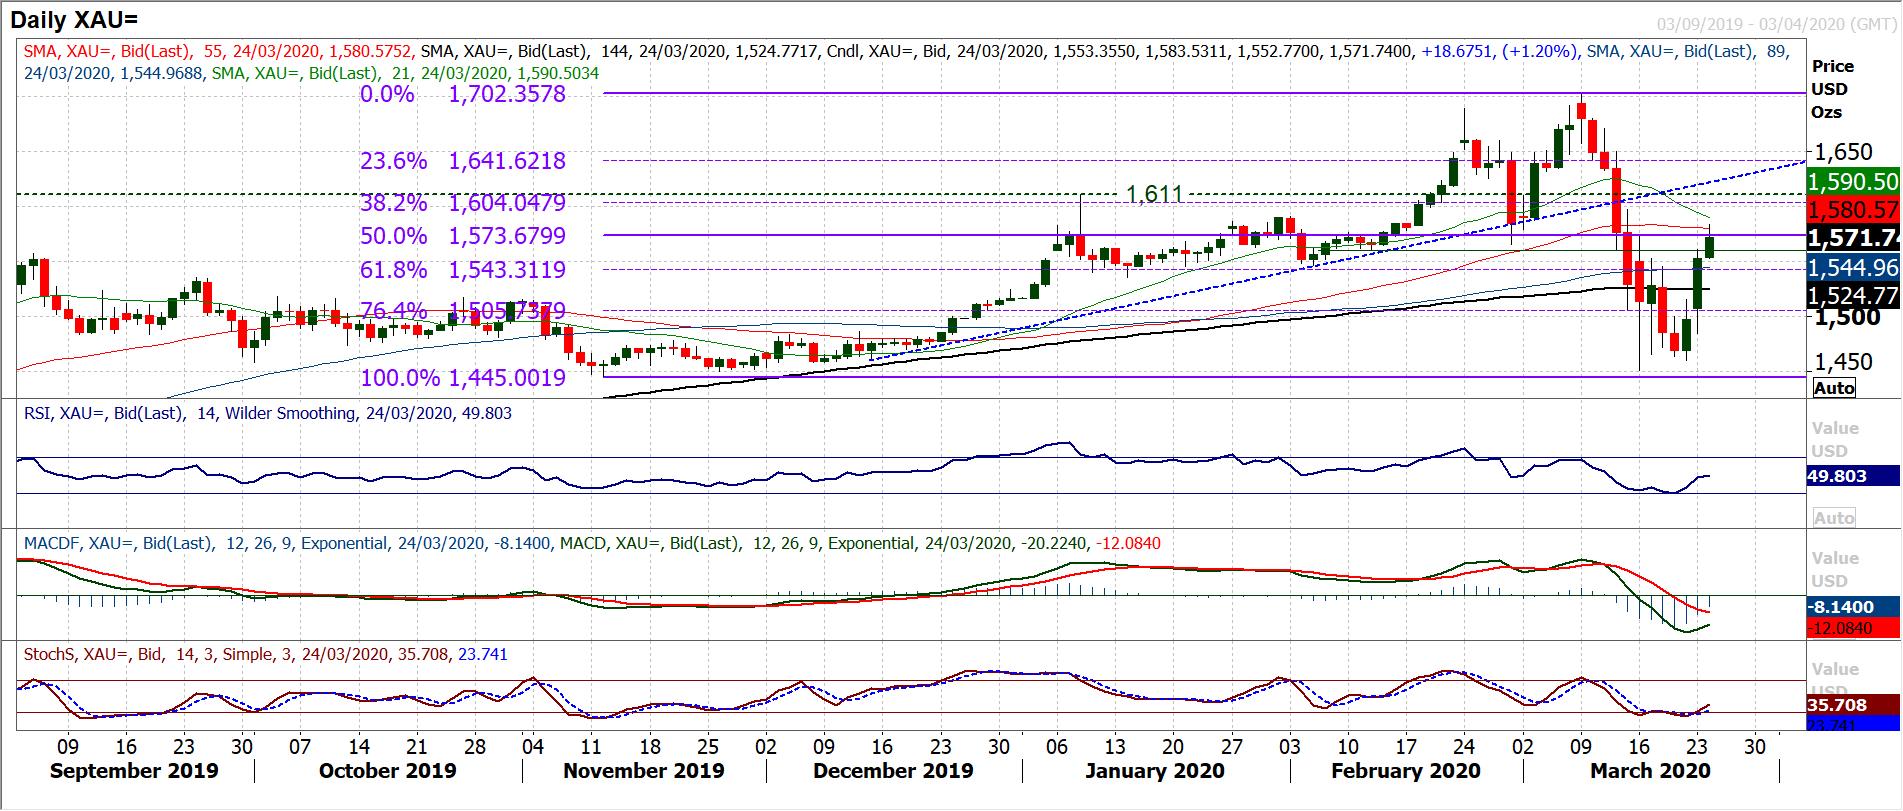
After a huge sell-off on gold over the past couple of weeks, we are starting to see serious momentum in a recovery. Posting two consecutive positive candles (and developing into a third today) the rebound has left good support now at $1450/$1460 and is driving through the technical barriers that the bulls need to see for confirmation. The hourly chart shows this well, with the move initially above resistance at $1519 yesterday but also above $1553. This has completed a breakout for a base pattern. With momentum indicators increasingly positive on the hourly chart (RSI consistently between 40/80 whilst MACD lines are also around two week highs), the daily chart momentum is also increasingly in recovery mode. The daily chart looks to be at an interesting crossroads this morning. RSI has picked up to 50 and the rebound is trading around the 50% Fibonacci retracement (of the original $1445/$1702 rally) at $1573. A closing move decisively clear of the Fib level opens $1597 resistance and the old $1611 breakout. The hourly base pattern implies around $90 of recovery target (towards $1645) whilst there is a good band of support $1519/$1553 now as a near term “buy zone”. Initial resistance at today’s early high of $1583.
WTI Oil
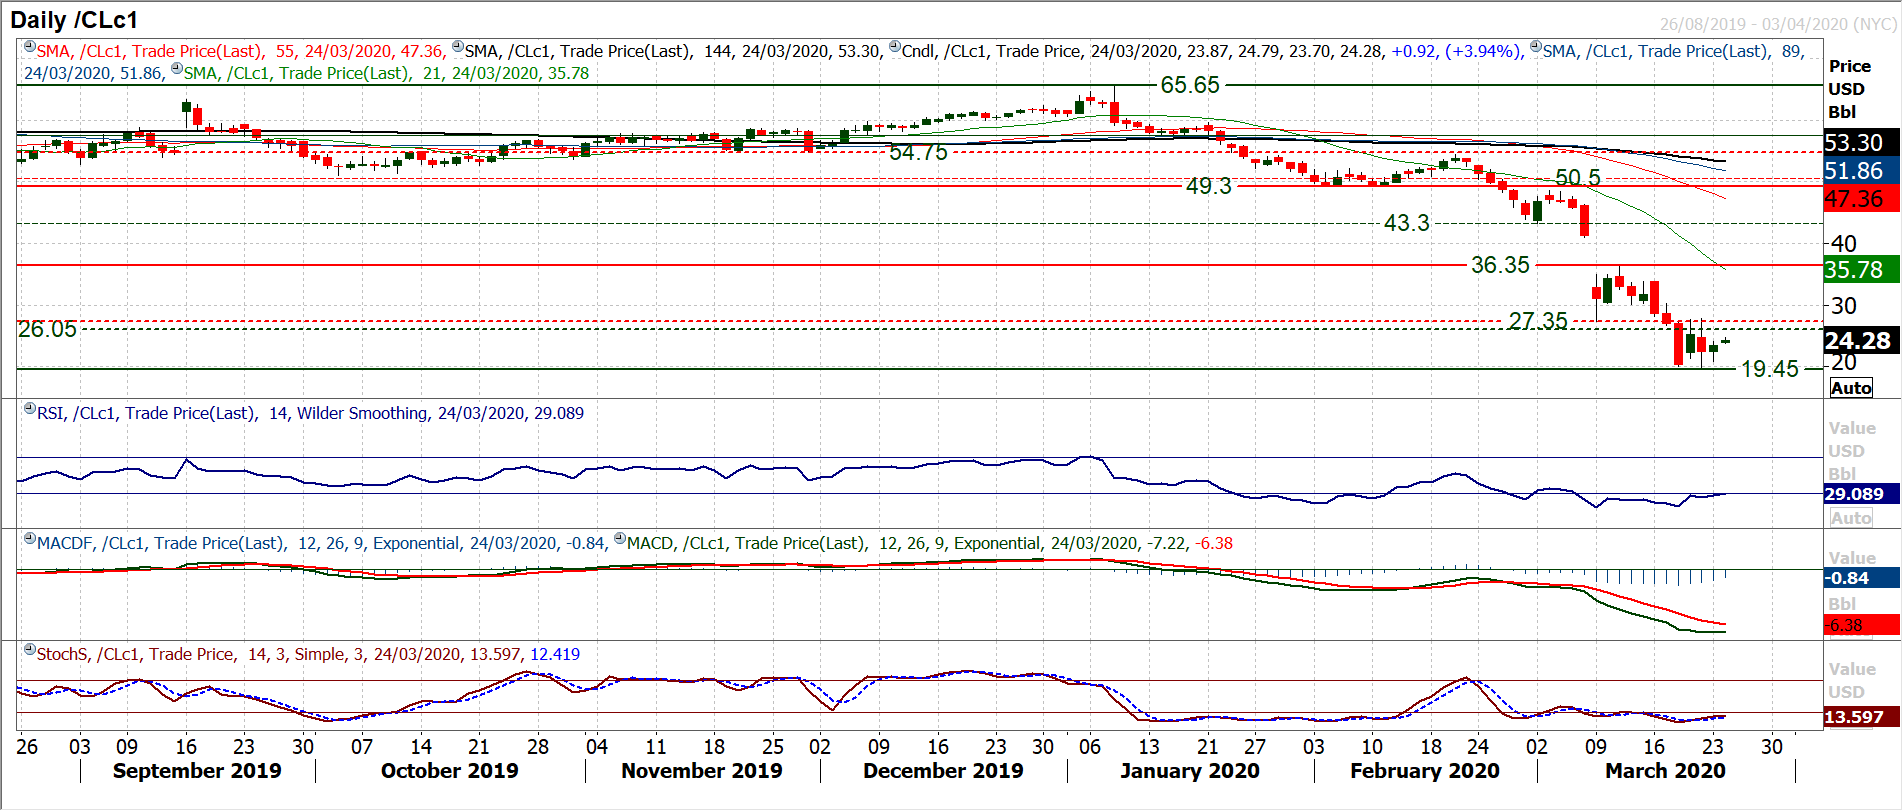
The tide of massive selling pressure has been stemmed over the past few sessions (even if a new multi-year low of $19.45 was touched on Friday). A mix of positive and negative candles are forming and a degree of consolidation is developing. The volatility is still huge, but at least this is no longer resulting in persistent price crashes. This is beginning to now be reflected in momentum indicators. Daily studies are ticking higher (especially the RSI which back above 30 would be a two week high). The next step though is breaking key lower highs, and that means $27.90 (Friday’s high) needs to be breached on a closing basis. Already we are seeing hourly momentum suggesting consolidation (RSI between 30/70 for the past three sessions). The hourly RSI moving above 70 would suggest recovery beginning to form. Above $27.90 would be a small base pattern and imply $8.50 of additional upside recovery. The bulls need to hold on to $21.80 as initial support today to maintain the sense of hope.
Dow Jones Industrial Average
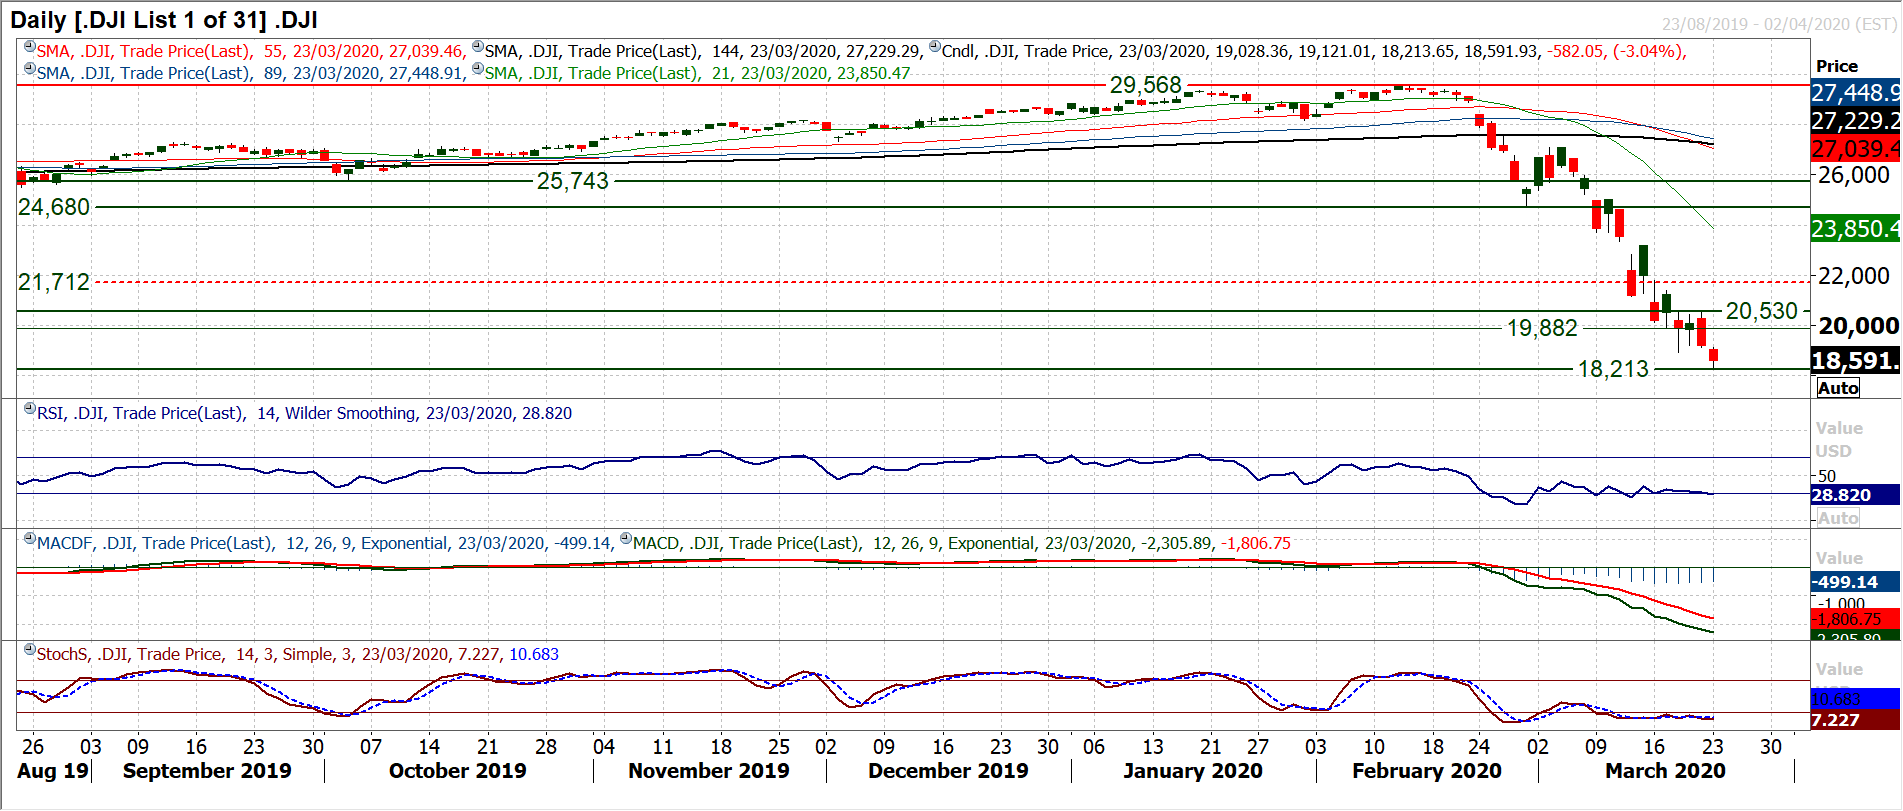
After a mammoth climb for over three years, yesterday the Dow Jones Industrial Average entirely retraced the gains of the Donald Trump presidency. Another breach of support (last week’s low at 18,917), another multi year low, and a continuation of the sell-off. This time, the support had at least held for two sessions, so that was an improvement on the past two weeks, but the decline continues. Momentum indicators just look resigned to it now. They are just entrenched in a perpetual bearish configuration now, drifting in negativity and steadfast in position of selling into strength. The hourly chart shows little cause for encouragement either, with RSI stuck in a rut between 25/50 and MACD lines stuck below neutral. We now see 18,915 as initial resistance and it would take a rally above 20,518 to suggest there is any realistic hope of momentum in a rebound. Futures are looking positive early today, but keep in mind that throughout the sell-off there has never been two positive sessions in a row. Yesterday’s low around 18,215 is initial support, whilst 17,885 (the November 2016 low) is the next key support of note and is a test which has to be anticipated.
