Market Overview
A swing to a marginally more positive outlook for major markets has taken hold as the European session kicks in today. There has been a nod of encouragement towards the US Congress passing a $480bn relief bill for small businesses. How long this move lasts though will be interesting. A continued rout in the price of oil may be bearing little significance this morning, but it smacks of bigger macro fears. Reduced economic activity and deflation concerns remain. The “bull flattening” of the US yield curve once more, where longer-dated yields fall faster than shorter-dated yields, reflects this too. Recent sessions have taken a more risk negative bias and this trend could well come back to bite again on a morning with little real newsflow to hold a sustainable rally. A slight US dollar slip is in line with the marginal risk positive outlook this morning. Equity markets are bouncing initially with US futures around +1% higher. The Aussie and Kiwi are performing well too. With several major markets eyeing technical support levels yesterday, the response needs to be decisive to prevent momentum gathering in a renewed correction. UK inflation was in line with expectations this morning as both core and headline CPI slipped slightly. UK headline CPI dropped to +1.5% (+1.5% exp, down from +1.7% in February) whilst UK Core CPI was a shad down to +1.6% (+1.6% exp, down from 1.7% in February).

Wall Street closed sharply lower for the second session in a row, with S&P 500 -3.0% at 2758. However, with the E-mini S&P futures +1.0% higher this morning, this is helping to stabilise sentiment. Asian markets were mixed overnight, with the Nikkei -0.7% and Shanghai Composite +0.3%. European markets are also looking more positive today, with FTSE futures +0.9% and DAX futures +1.1%. In forex, we see a marginal USD negative and risk positive session. AUD and NZD are outperforming, whilst CAD has also found a degree of respite. In commodities, the slide in precious metals continues, with gold falling marginally again, and silver -1.5% lower. Another day, another sell-off on oil, with WTI (now the June contract) down -7% and Brent Crude down -13%.
There is little of note on the economic calendar until the US session later today. Eurozone Consumer Confidence is at 1500BST and is expected to at 1330BST is expected to decline to -19.6 in April (from -11.6 in March) which would be the lowest since May 2013. With all the headlines the glut of oil supply and lack of storage, the EIA Crude Oil Inventories will be key to watch at 1530BST. Another huge inventory build of 16.1m barrels is expected, after last week’s massive +19.2m barrels of the build.
Chart of the Day – AUD/JPY
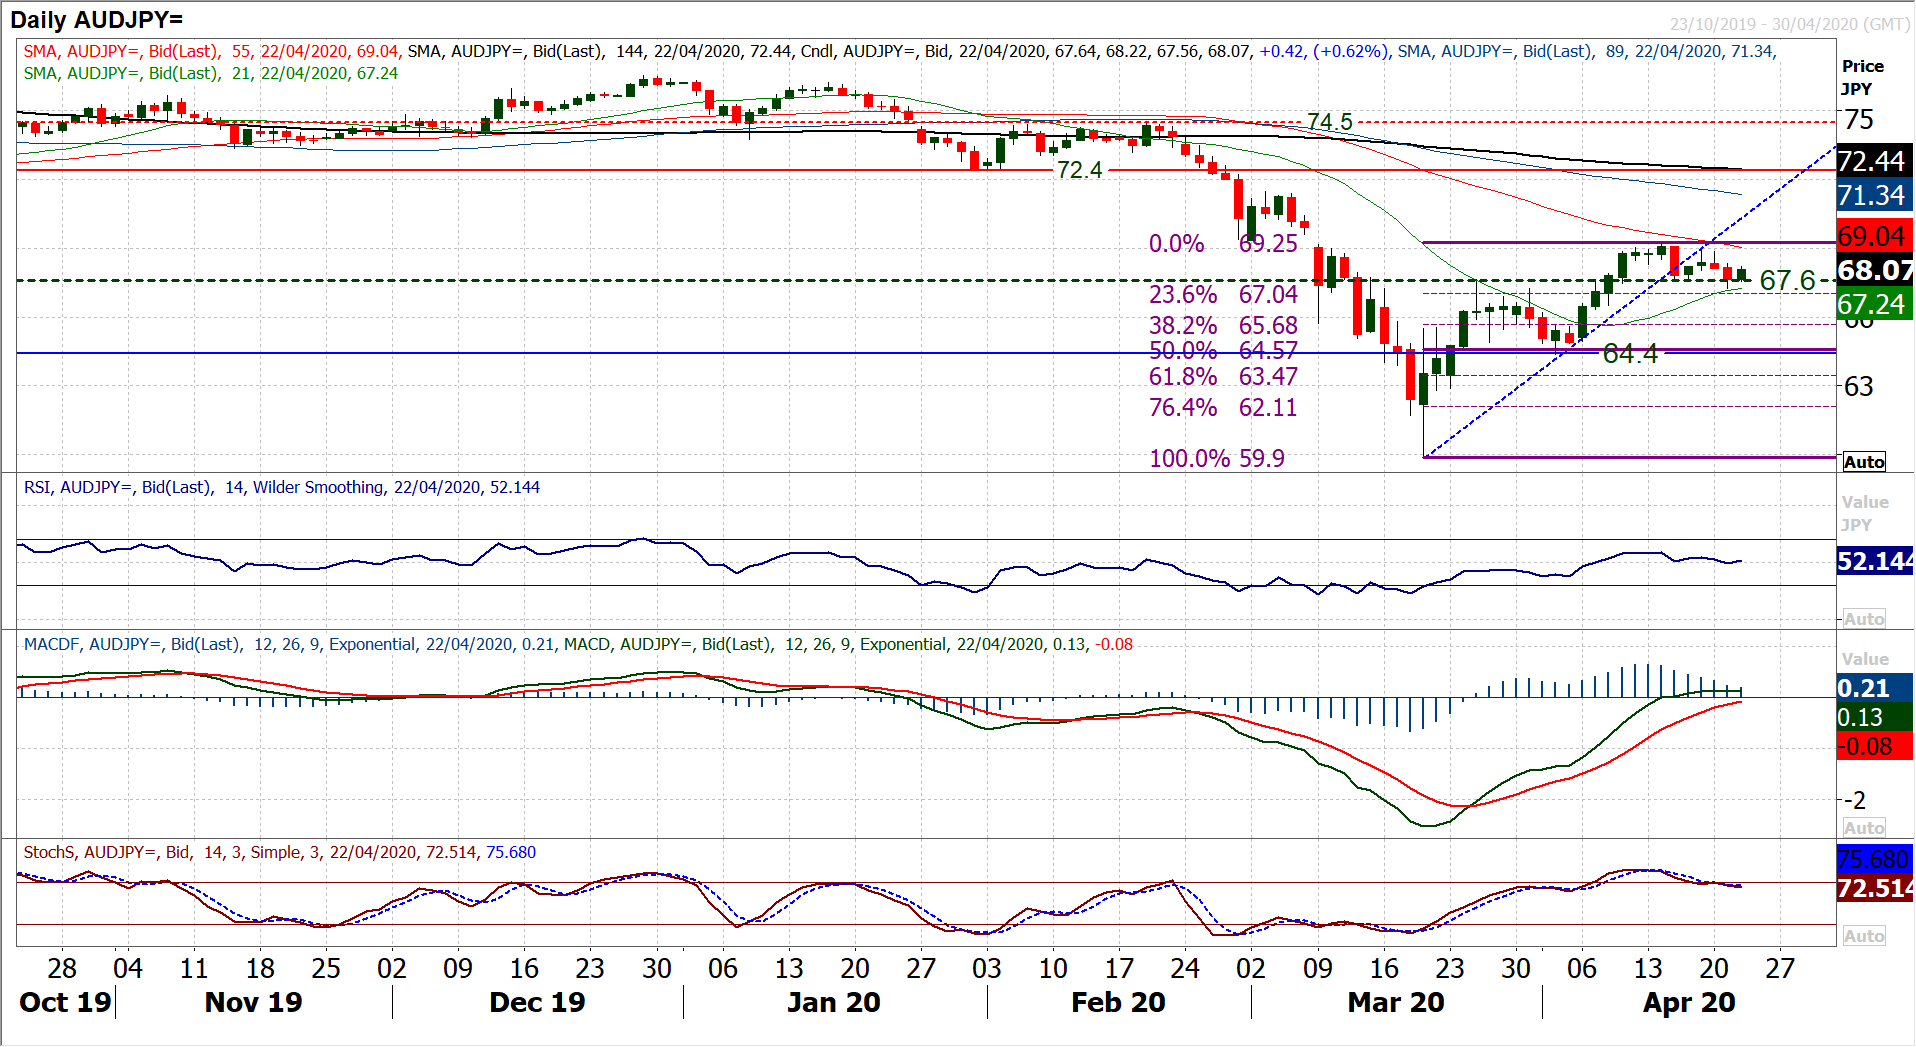
We often see Aussie/Yen as a good gauge for broader market risk appetite. Given that sentiment seems to be gradually turning more negative in recent sessions, is this reflected on the cross of AUD/JPY? With a broken recovery uptrend having already been a flashing warning light, it seems to be that the bulls are in retreat, but for now, the selling pressure has been restrained. A build-up of negative candles in conjunction with some bull failure candles suggests the recovery is turning into reverse. It will be interesting to see if this morning’s rebound also falls into this category of bull failures. The key for the near term outlook is still how the market reacts around the 67.60 pivots. Yesterday’s intraday breach of the key pivot did not confirm into the close, and the market is back higher again today. However, given the run of recent daily candles, the risk is on further pressure towards a test of 67.60. A close below 67.55 would confirm a new trend formation, with lower highs (at 69.25 and then 68.90) and lower lows (on the breach of 67.55). With the recovery losing its way, we draw in new Fibonacci retracements (of 59.90/69.25), meaning that 23.6% Fib around 67.05 would be another key near term gauge for a correction to take hold. A decisive closing breach of 23.6% Fib would open deeper retracements, with the prime support glaring with 50% Fib at 64.57. With Stochastics bear crossing lower this is a warning, but RSI and MACD lines are still lacking a conviction for a sell-off. The hourly chart shows this morning’s rally struggling in the near term resistance band 68.00/68.20 with the risk of another bull failure, as increasingly corrective hourly momentum takes hold. Above 68.85 renews the positive outlook.
EUR/USD
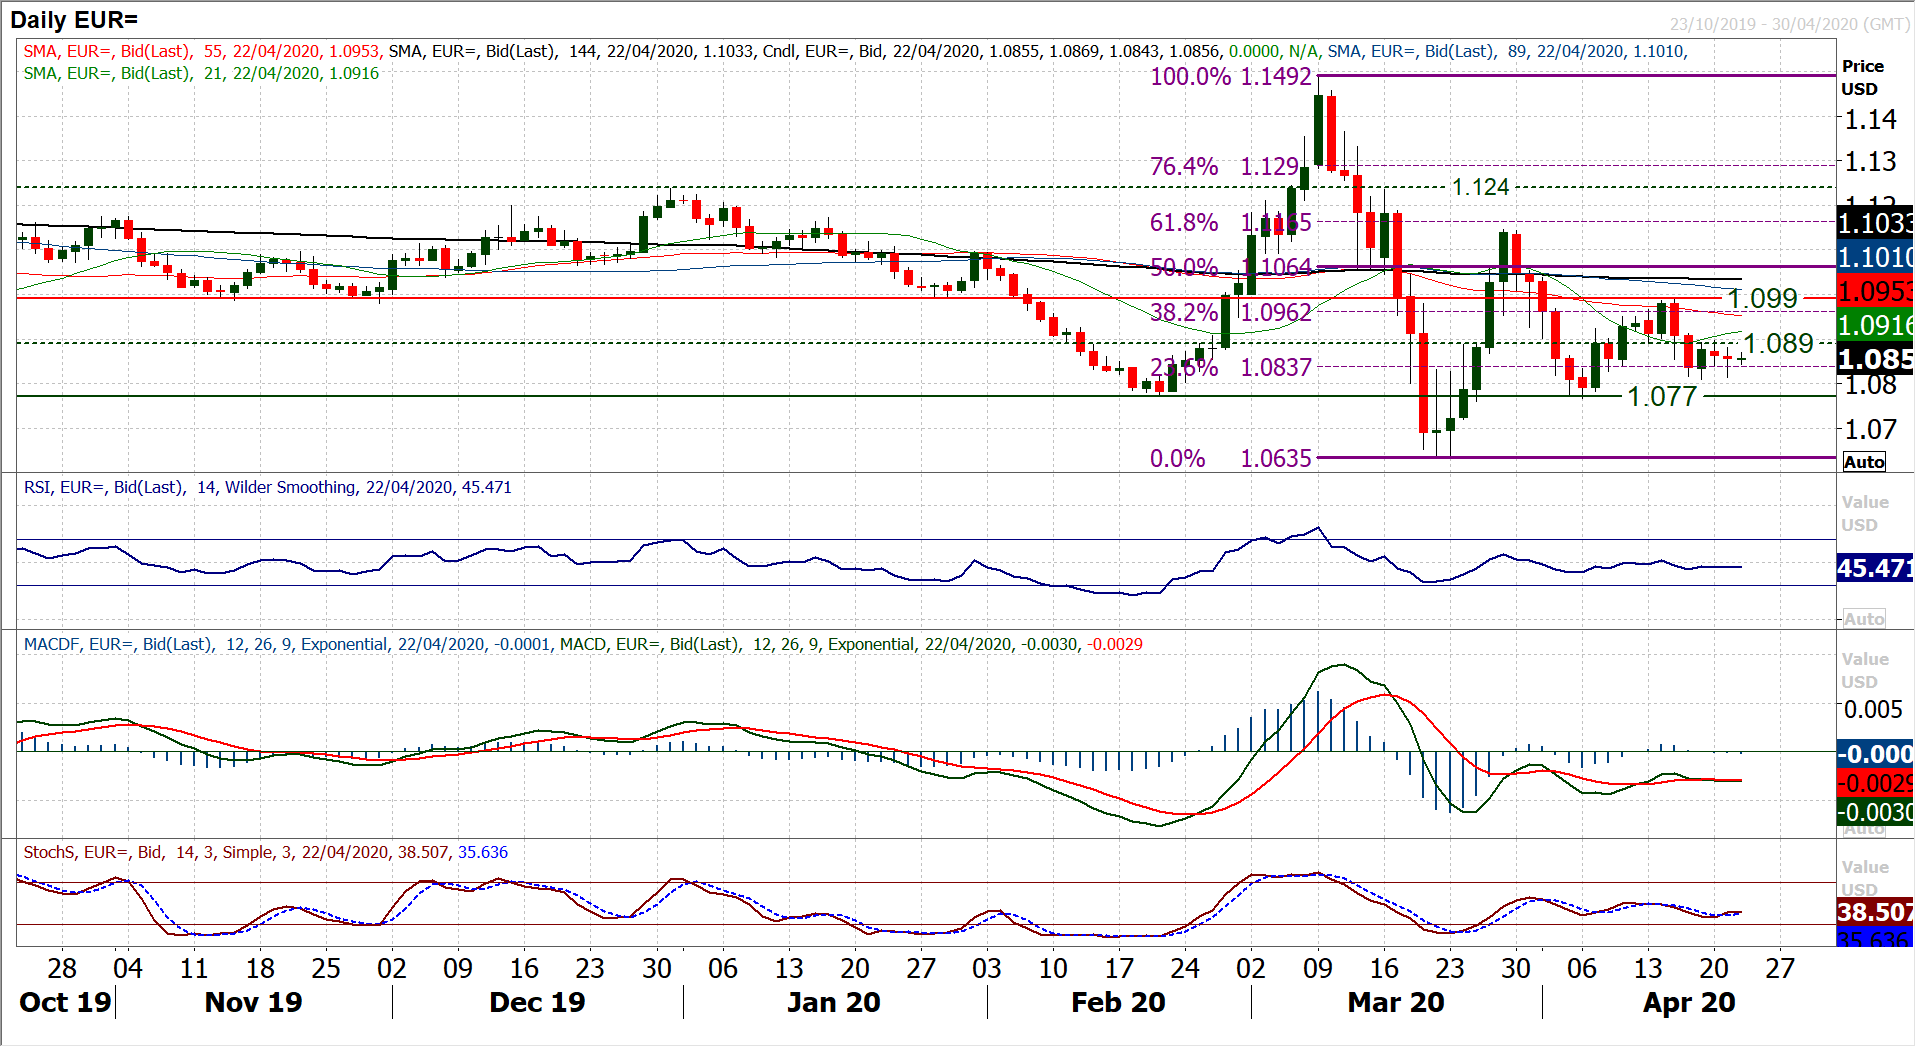
It was interesting to see the euro holding up relatively well in the face of dollar strengthening yesterday. The bulls are fighting hard to prevent renewed negative momentum on EUR/USD. The defence of $1.0810 continues to hold as the market has spent the past three sessions in tight consolidation between the support at $1.0810 and pivot resistance at $1.0890. Despite this, there is still an ongoing negative bias which is present on EUR/USD and we continue to see intraday rallies as a chance to sell. Throughout April, there has been a pivot around $1.0890 and trading below this suggests a bias towards $1.0810 but also the increased potential for testing $1.0770, the key April low. Small bodied negative candles in recent days, and again this morning also suggest the marginal drift lower is underway. This is again reflected in the momentum on the daily chart, with all indicators stable below their neutral points, whilst a similar configuration is seen on the hourly momentum too. For now we wait for the next decisive break, either clear below $1.0810, or above $1.0925 (which would be a confirmed break above the $1.0890 pivot) in what is a very quiet period of trading for EUR/USD.
GBP/USD
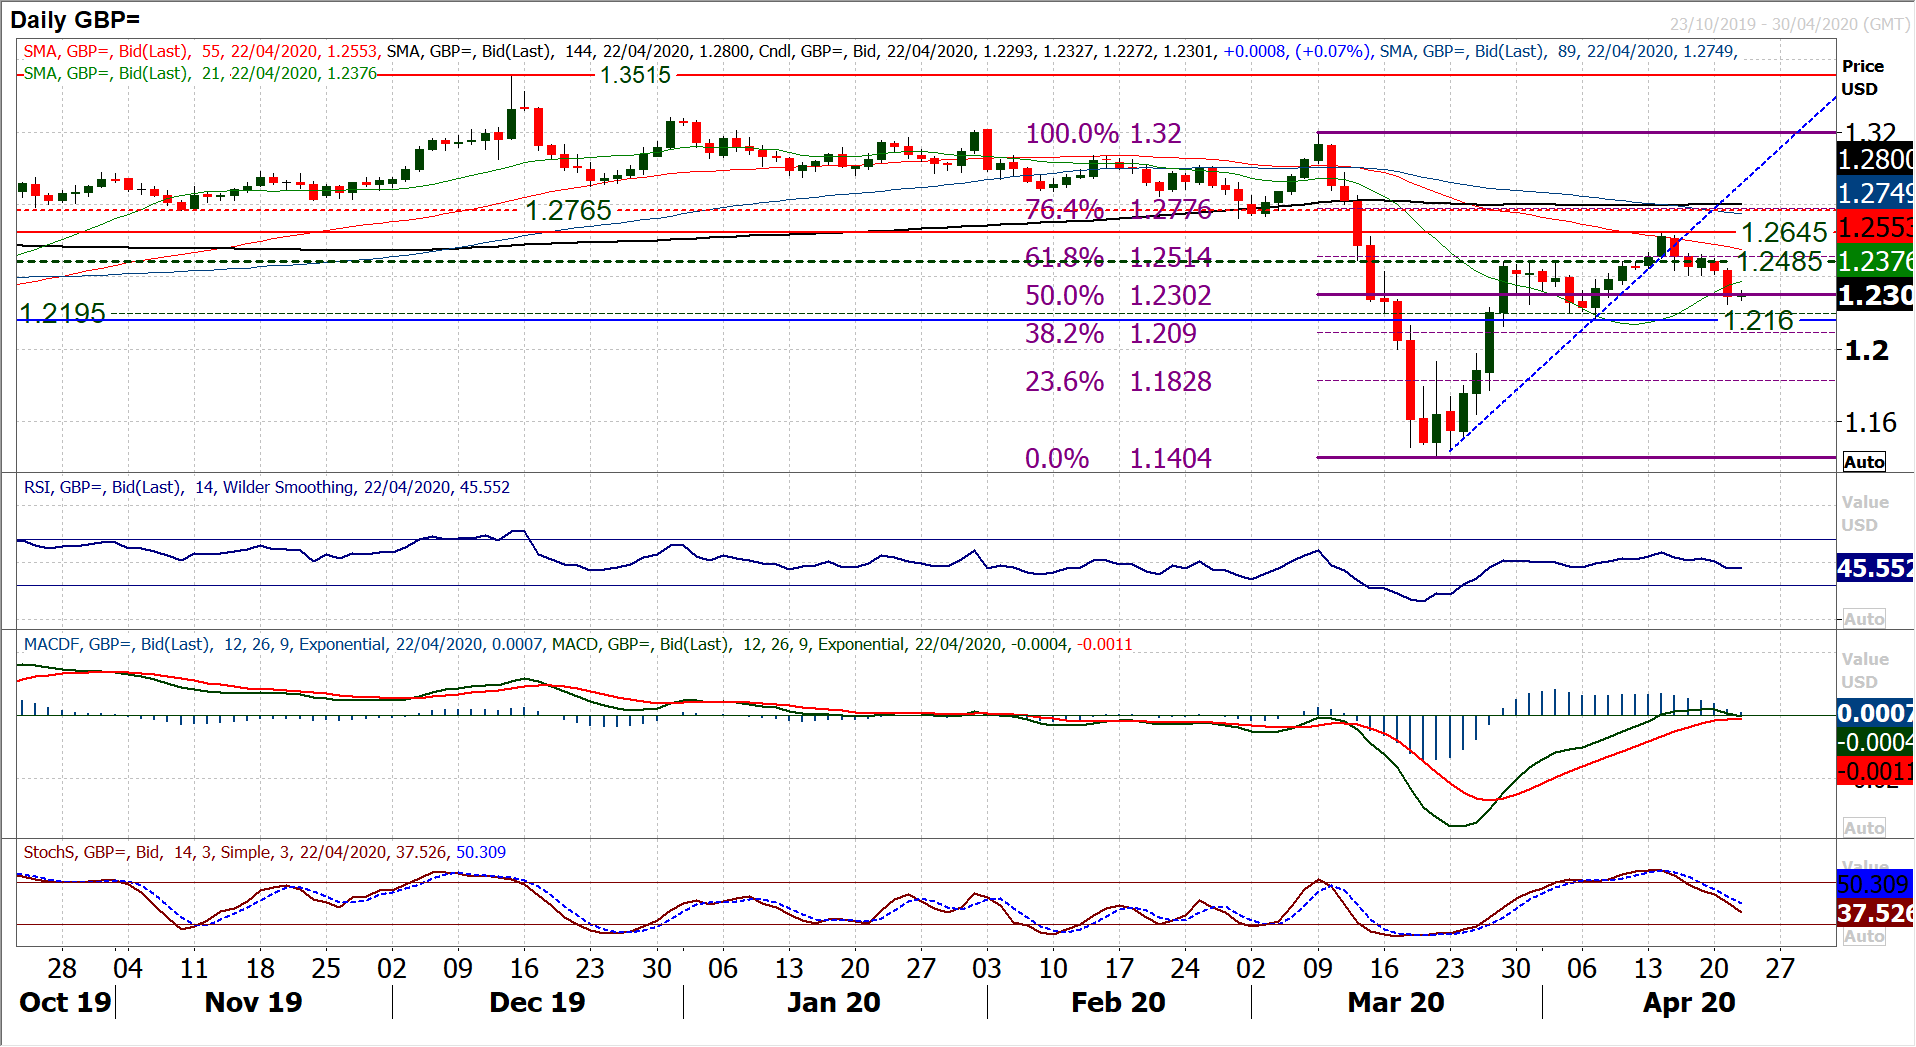
We have been discussing the gradual erosion of the gains on Cable in recent days, however, the move accelerated yesterday with a decisive negative candlestick. This candle has shown intent for the bears to take control of the market and important support levels are now being eyed. There is a basis of consolidation around the 50% Fibonacci retracement (of $1.3200/$1.1405) today, around $1.2300. However, given the strength of the selling pressure yesterday, the Cable bulls are going to do well to contain the move around here. Daily momentum is turning decisively lower now, with the Stochastics accelerating below their neutral point, whilst MACD lines are also close to forming a bear cross around neutral. The key April higher low at $1.2160 is seen as a crucial gauge now. A decisive breach would be a massive breakdown and a bearish signal suggesting a real renewed downside could set in. Given the speed of the recovery in late March, there is little react support to speak of until $1.1930 area. The 38.2% Fib is at $1.2090 as the next consolidation zone. There is resistance for the bulls initially around $1.2300 and then $1.2400. We are now sellers into near term strength.
USD/JPY
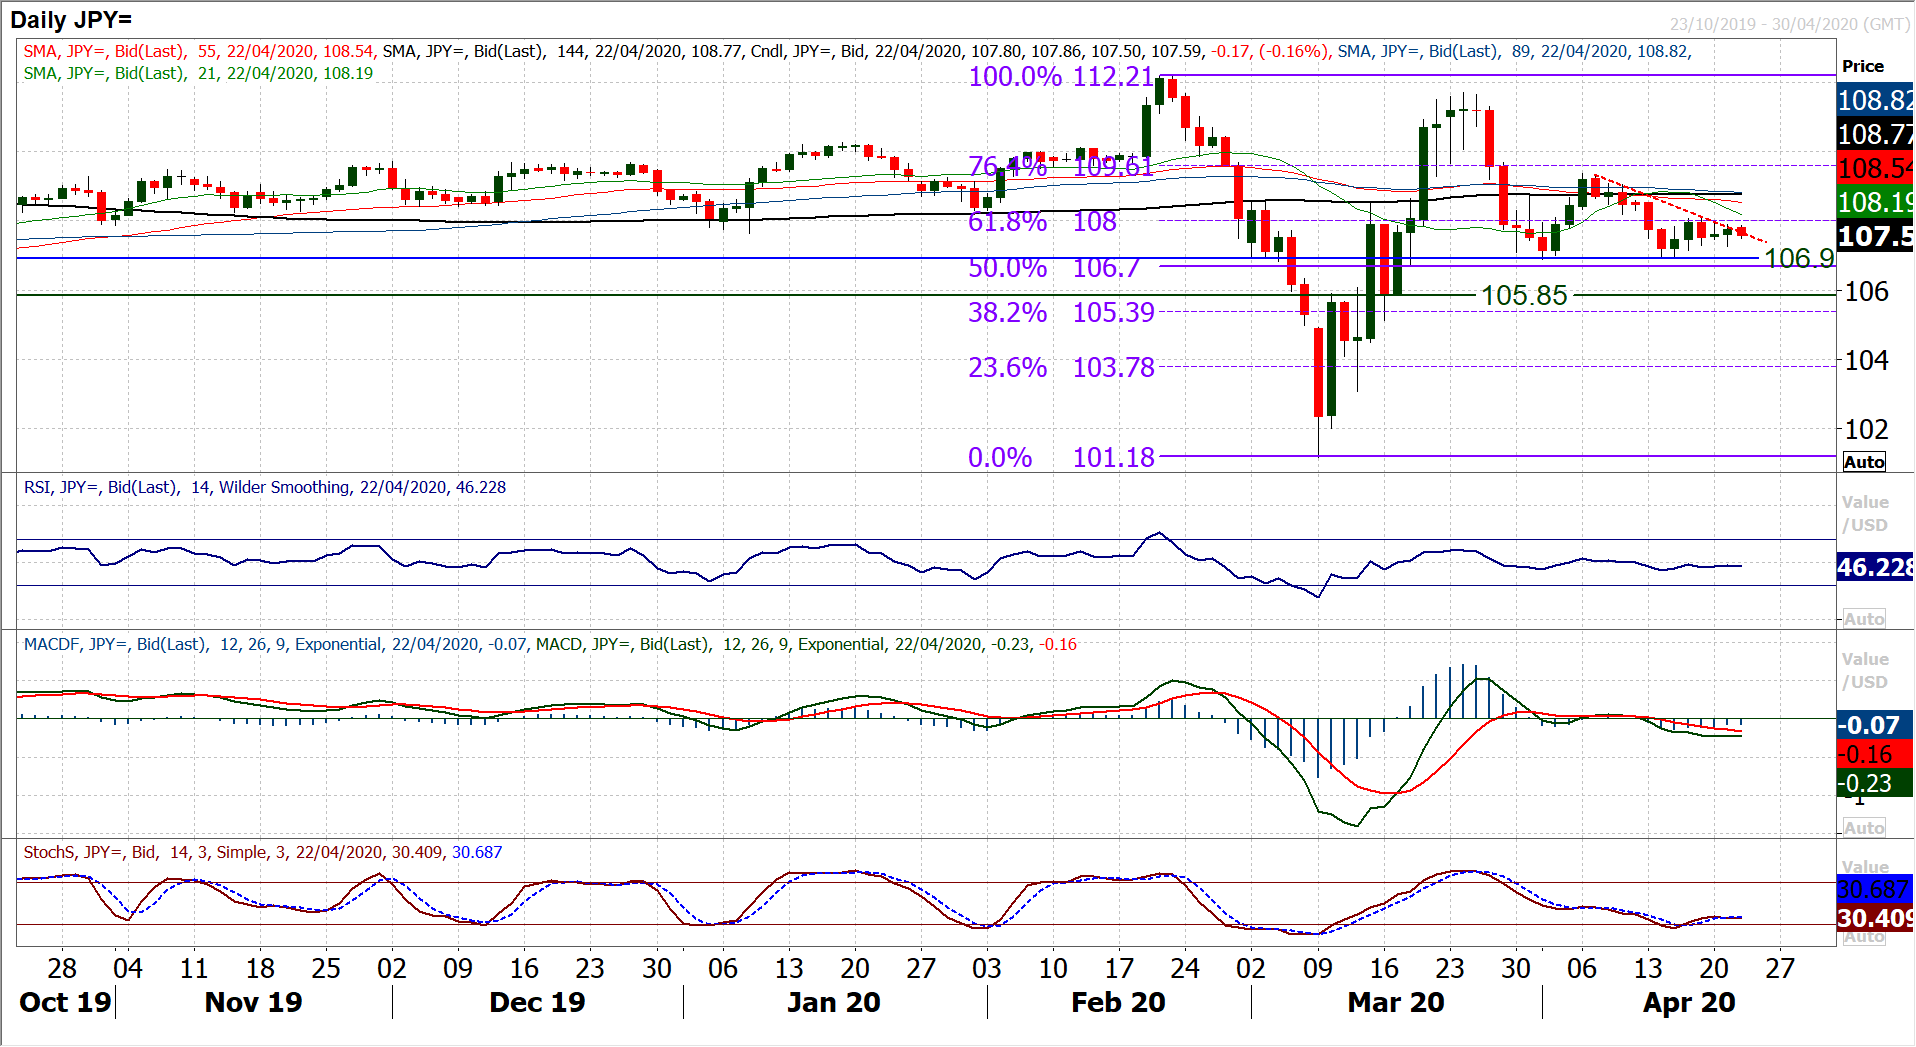
There has been a loss of direction as Dollar/Yen has consolidated in the past few sessions. As a lack of conviction has increasingly taken over. Even the shallow two-week downtrend has been broken this morning, in a move that plays into the neutralising of even the mild negative bias. Essentially Dollar/Yen is now rangebound. It is seeing upside fading under the clutch of resistance between 108.00/108.20. The 61.8% Fibonacci retracement (of 112.20/101.20) at 108.00 has become resistant on the daily chart, whilst the hourly chart shows a pivot at 108.20. However, the selling pressure is not enough to meaningfully take on the 106.90 April lows either. The hourly chart shows that there is also an appetite to support too, with the lows of each of the past few sessions between 107.15/107.30. Daily momentum is increasingly benign. We have the mildest of negative preferences for pressure on the support levels, but lack conviction and this is a market in need of a catalyst now.
Gold
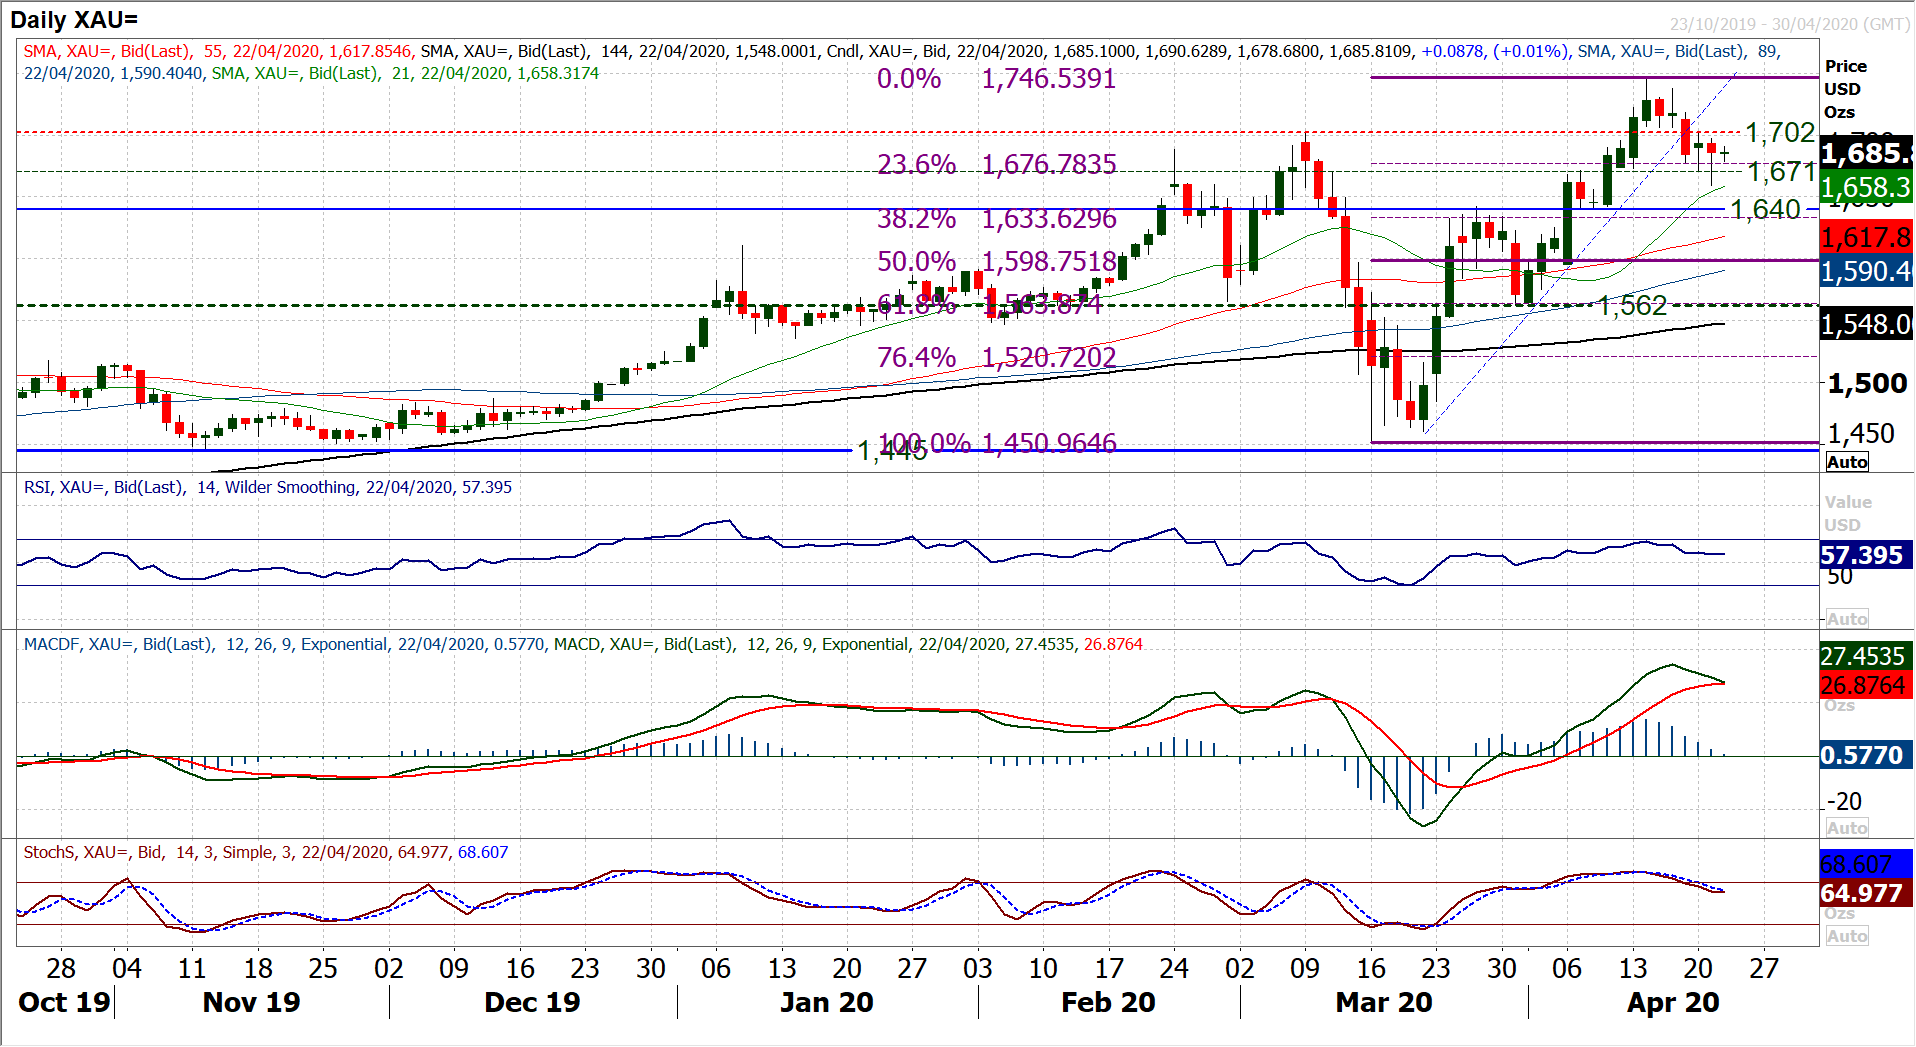
The drift lower on gold continues as the run of lower daily highs is now into its fourth session today. The market remains stuck under the resistance of the previous breakout of $1702 and for now, the near term corrective outlook continues. Yesterday, we began to consider the prospect that the correction had already played out. The hourly chart shows a small top pattern implying $1666/$1671 as a target area, and this has now been achieved. The hourly chart shows an intraday breach of the pivot support at $1671 but also what is now a continued failure of the hourly RSI around 60. Although the market quickly regained $1671, this configuration suggests that risk remains to the downside for now. The hourly MACD lines failing around neutral play into this too. So we keep our powder dry in regards to buying into this weakness. This is a market that needs confirmation that the corrective move is done. Hourly RSI consistently above 60, hourly MACD consistently above neutral, and most importantly a decisive breach of $1702 resistance is required. This would break the run of lower highs and change the near term trend. The bulls will be encouraged if $1671 can again be held today into the close. If not, then the next downside target for the correction would be $1640.
WTI Oil
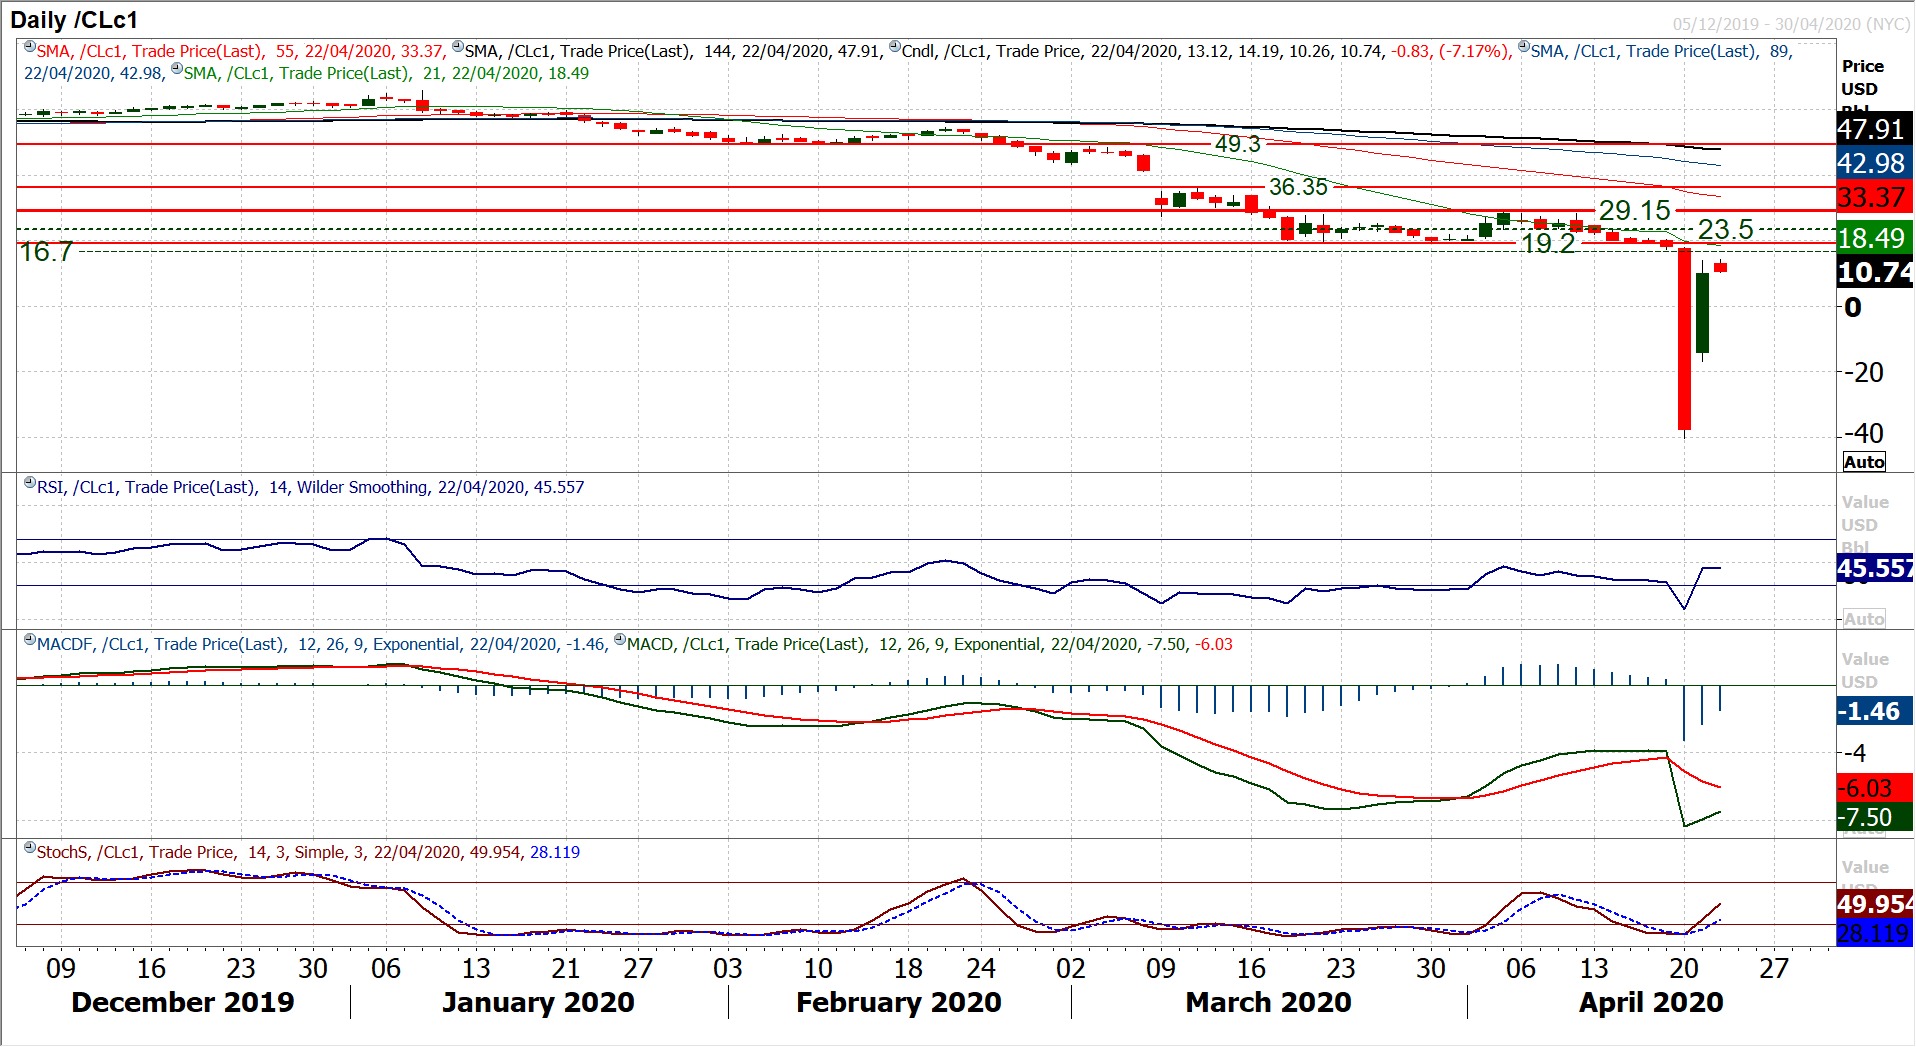
Looking at technical on WTI is almost meaningless for the time being. The huge swings on the continuation chart due to the volatility in futures contracts and rollover have rendered the analysis of price moves almost worthless. Ultimately, we continue to see the market under pressure today as the June contract becomes the new front month and takes hold as the continuation price. A negative candle has therefore taken shape on the daily chart. We expect oil to continue to fall, with no support in place. We cannot rule out a repeat of the enormous selling pressure as the June contract moves towards expiry in a few weeks time.
Dow Jones Industrial Average
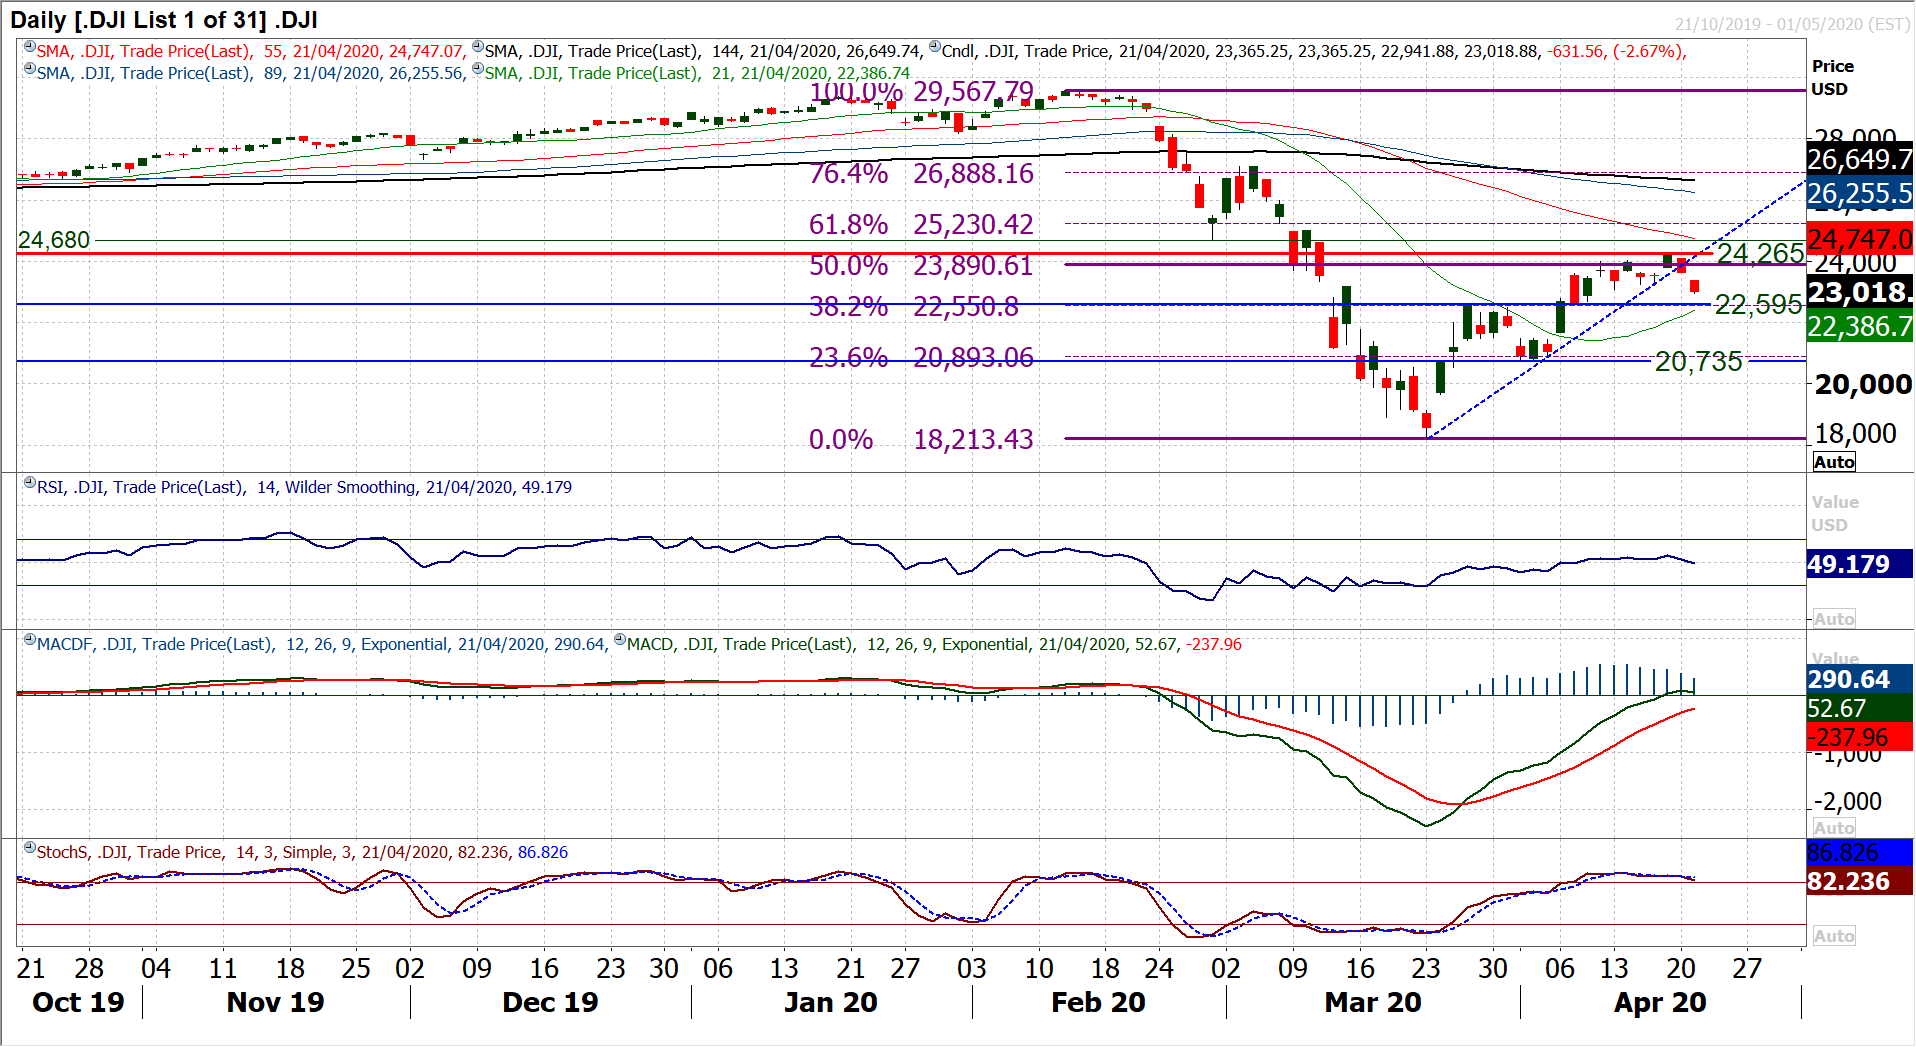
Our fears of renewed selling pressure taking hold on equities have grown in the past couple of sessions. The bulls now have a big job on their hands to prevent a sizeable unwinding of the recovery again. The Dow’s recovery uptrend was breached on Monday, and the market gapped significantly lower yesterday (from 23,627) in another negative session that breached support at 23,095. This is not the first time that recovery support has been breached since the March low, but how the bulls react now will be crucial. The last time we saw a big gap lower, the bulls reacted quickly and prevented the sell-off from ever gathering momentum. Subsequently, a combination of support from the breakout at 22,595 and the 38.2% Fibonacci retracement (of the 29,567/18,213 sell-off) at 22,550 will be vital now. Interestingly, momentum indicators are tailing off, rather than falling decisively yet, so there is still an element of control to the selling pressure. This is reflected in the hourly chart where RSI and MACD are only moderately corrective. Trading back above 23,095 would help to encourage some bull support, whilst initial resistance is at 23,365.
