Market Overview
For a few days, there had been signs of improvement in sentiment, as the outlook of COVID-19 (what used to be the Coronavirus) showed signs of peaking and positioning of risk in financial markets picked up. However, this improvement has been dealt a sizeable blow overnight as a sharp rise in the number of cases and deaths has been announced. The Chinese authorities have changed the methodology of how they record the number of cases of the virus (to include “clinically diagnosed”), causing the statistics to balloon by over 13,000 in one day. Clearly far more than they would previously have been. Whilst this is simply a statistical deterioration, but still, it is a shock to markets which had been beginning to price for the worst having been passed. Furthermore, the shutdown of businesses and schools in the Hubei region (where the virus is most prevalent) has been extended. The region will not be getting back to normal any time soon. This all has come as a jolt to trading confidence and the natural knee jerk back into safety has been seen. Bond yields have been steadily improving in recent sessions, but the 10 year Treasury yield is around -5bps off yesterday’s close, whilst the yen is strengthening along with gold. On the flip-side, there are moves out of NZD and AUD. Equities have been strong in recent sessions, with Wall Street at all-time highs across the board, but futures are dropping back this morning. However, at the moment the shift back into safety has not shown too much panic and we expect this to be short-lived. Trends in the next few days could be key again.

Wall Street closed decisively higher once more with the S&P 500 +0.6% at 3379 and again well into all-time highs. US futures are though unwinding some of this today, down -0.4% which is dragging on Asian markets with the Nikkei -0.1% and Shanghai Composite -0.7%. European indices are set for losses early today, with FTSE futures -0.6% and DAX futures -0.4%. In forex, there is a mild shift back into safety with JPY outperformance, whilst AUD and NZD are lower. In commodities, the safe haven bias is helping gold +0.5% higher, whilst oil is flat having given back earlier gains.
US inflation is in focus on the economic calendar today. After a quiet European morning, the US CPI data is the first major announcement at 1330GMT. US Headline CPI is expected to increase by +0.2% in January to pull the year on year increase in inflation to +2.4% (from +2.3% in December). US Core CPI is expected to also grow by +0.2% in January, but this would mean a year on year slip back to +2.2% (from +2.3% in December). The US Weekly Jobless Claims at 1330GMT are expected to rise slightly to 210,000 (from a near 10 month low of 202,000 last week).
There is another Fed speaker today with John Williams (vice-chair, voter, centrist) is speaking late at 2230GMT.
Chart of the Day – AUD/USD
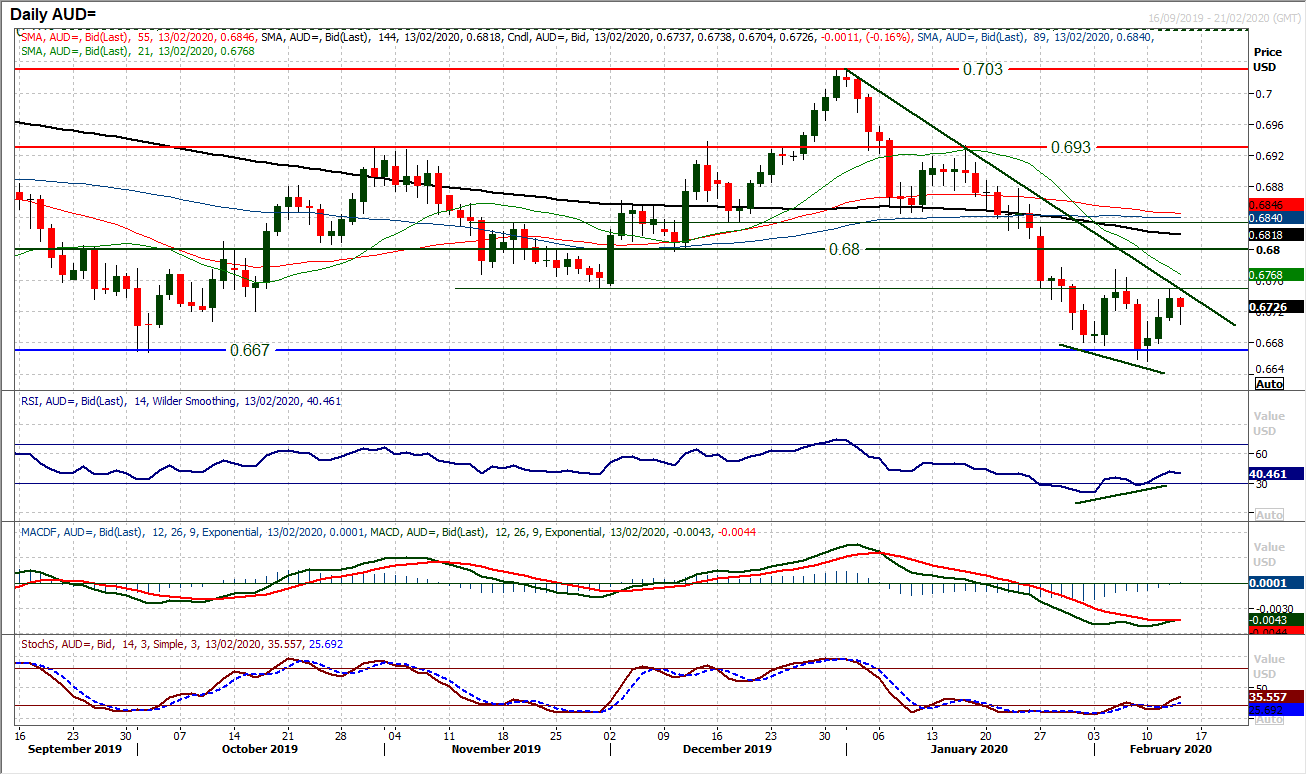
The Aussie has recovered well in the past few sessions, with three successive positive candles. This move has pulled AUD/USD higher to test a confluence of resistance at the old November key low of $0.6750 and a six week downtrend. Can it break higher? Initially this morning there has been a negative (risk-off) reaction to the latest update on Coronavirus. So reaction through today’s session and in the coming days will be key. The daily chart has shown the recent improvement coming with strengthening momentum indicators. A bullish divergence (with a positive failure swing) has been seen on the RSI moving above 40, whilst the Stochastics and MACD are about to post confirmed bull crosses. This is a key moment for the Aussie and if the market can build support then this slip back today could be an opportunity. The hourly chart shows the recovery is posting consistent higher lows with decent near term support now $0.6700/$0.6720 and positive hourly momentum configuration. Holding $0.6700 would be encouraging for the bulls now. There is still a need to break through resistance at $0.6760/$0.6775, to validate a recovery, but there is a more positive set up now to try and cope with this early slide back today. A close above $0.6750 would help to improve the outlook further and would open $0.6800/$0.6840 as the next recovery target area. Support comes at $0.6670 and then key at $0.6655.
EUR/USD
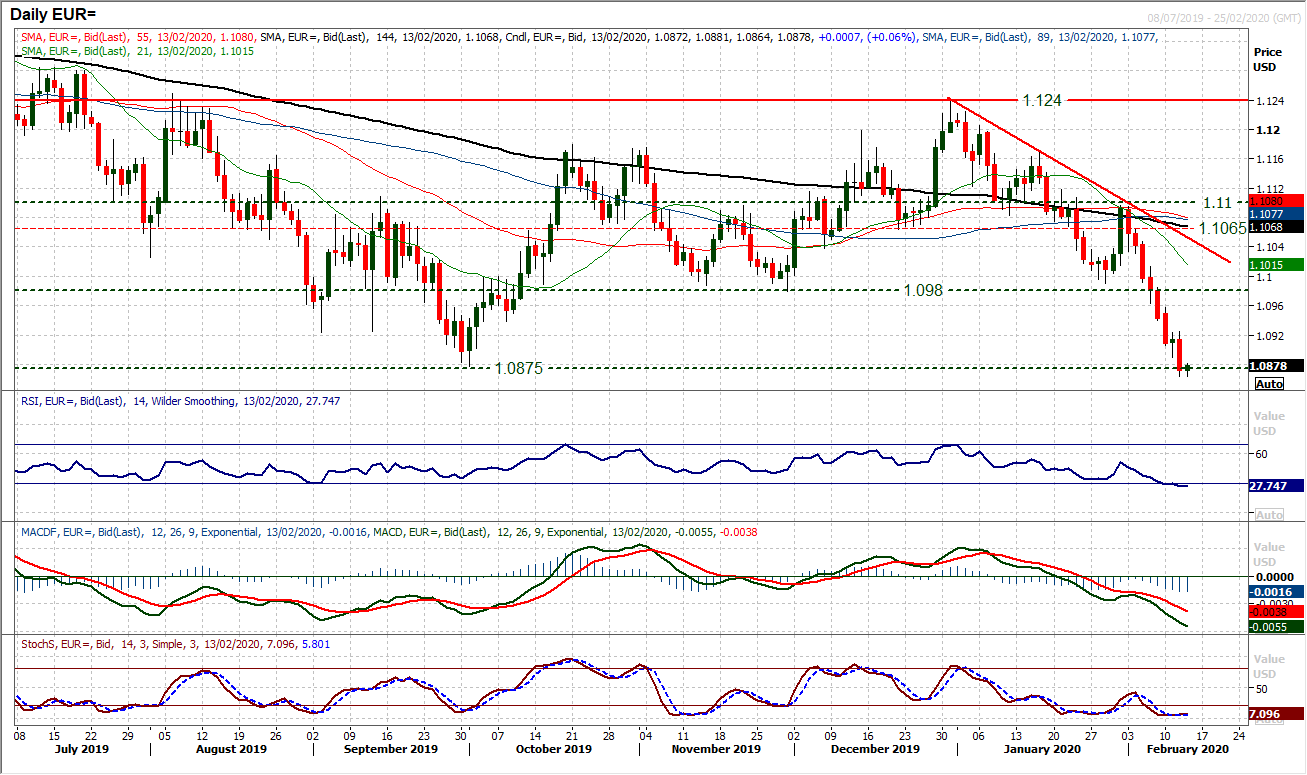
Another decisive negative candle formed as the market has now breached $1.0875 to close at its lowest since May 2017. In recent days we have been noting the extreme low level on the RSI which at below 30 (the lowest since May 2018) is very stretched but also reflects the bearish momentum. Right now the euro is clearly under a lot of pressure, but also may be close to a technical rally. So this is a tricky moment on EUR/USD. Downside potential appears limited and a technical rally is due, but the market is just falling like a stone. Also, closing below $1.0875 there is little real support until $1.0500/$1.0575. Notably, the hourly chart shows little sign of sustainable recovery yet. There needs to be a pull through meaningful resistance, whilst hourly RSI needs to be well into the 50s/60s and hourly MACD above neutral. There is resistance at $1.0900/$1.0925 needs to be overcome too. No sign of recovery yet.
GBP/USD
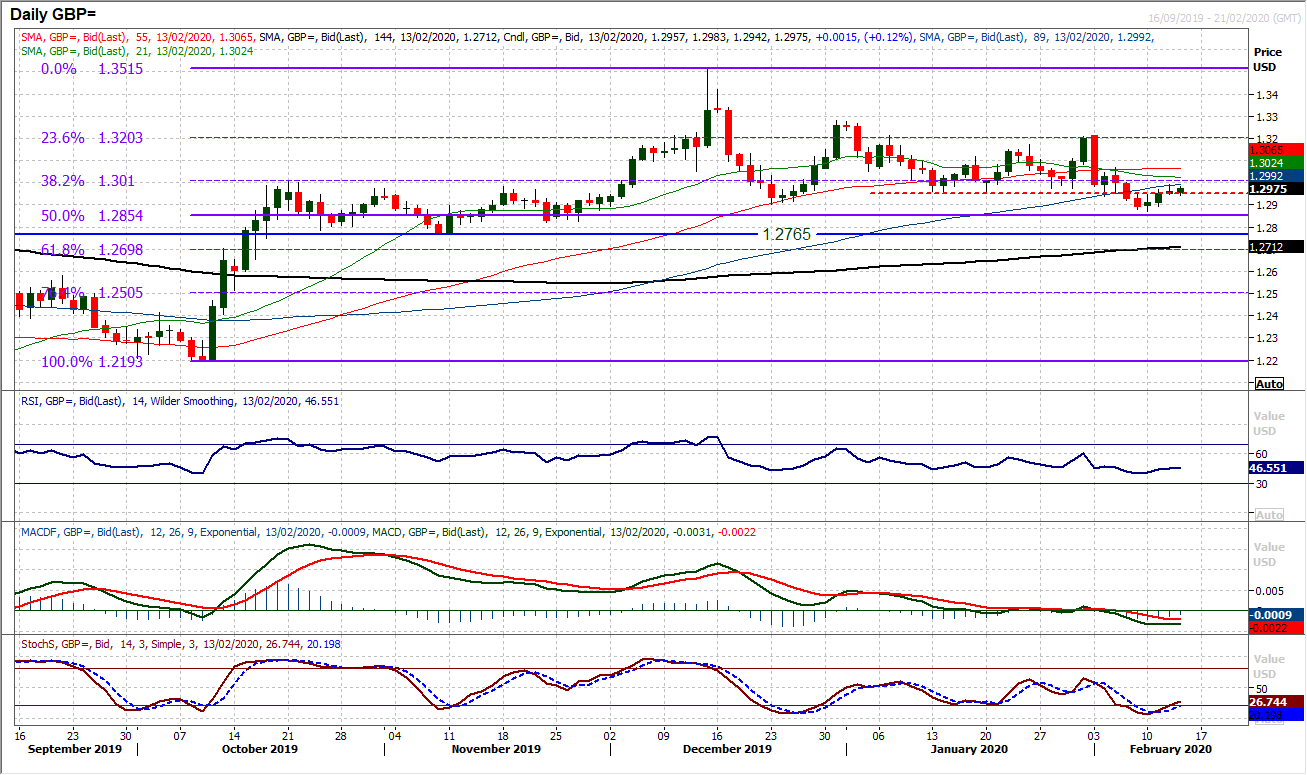
It was very interesting to see that although the euro remains stuck in the mire, sterling is holding up well. There has been a recovery that has been attempting to break through on Cable in recent days, but just been unable to break the shackles. There are improvements threatening across momentum indicators, with MACD and Stochastics showing signs of improvement, but not enough yet to be confident of a sustainable recovery momentum. On the hourly chart, we see that the past 24 hours, the market has been looking to move clear of the resistance band $1.2940/$1.2960 but has just been dragged back again. Positive momentum divergences have been setting Cable up for recovery, but again need to now show through with the price pulling higher. A decisive drop back below $1.2940 would now be a disappointment, and below $1.2895 would be a negative move once more. Resistance is at $1.2990 and adds to the barrier around the psychological $1.3000.
USD/JPY
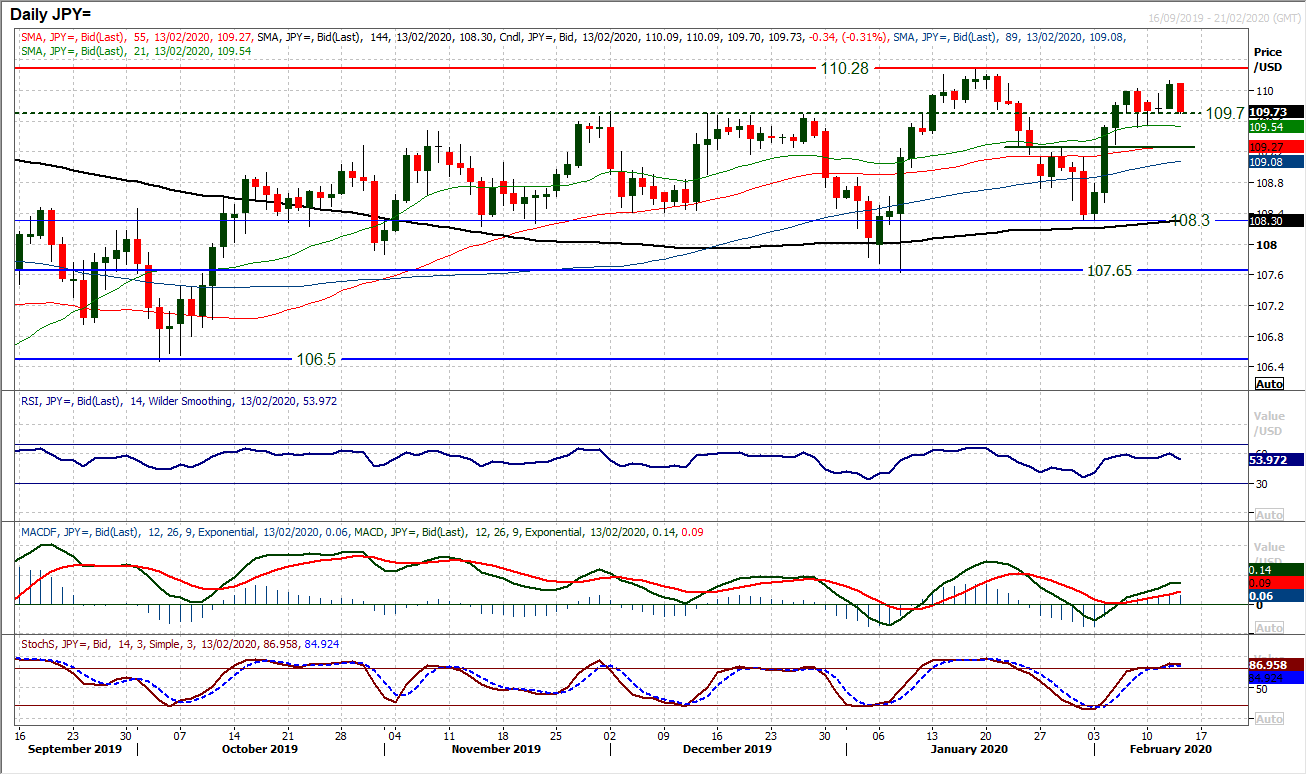
It looked as though Dollar/Yen was gradually beginning to make the move towards a test of 110.30 resistance. However, renewed fears of the Coronavirus overnight have shifted the emphasis early in today’s session back into yen strengthening. However, if the improving technical are anything to go by, then this will be a short lived decline and support will form once more. There is a positive bias on Dollar/Yen. This comes as the market continues to build above 109.50/109.70 which is supportive. With momentum indicators positively configured and with further upside potential, we continue to favour upside for a near term test and break above 110.30. This positive outlook will remain whilst the market holds above the recent pivot at 109.25. Near term weakness is a chance to buy.
Gold
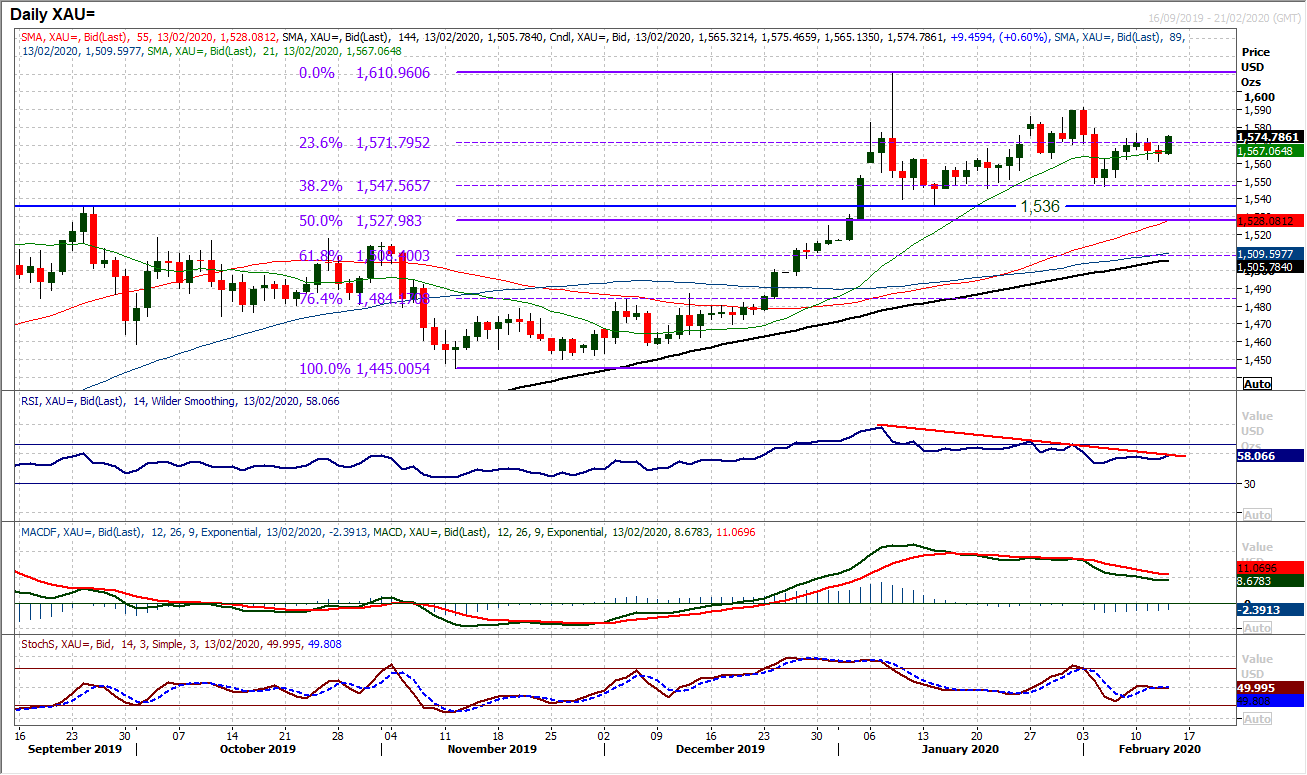
The near term consolidation of the past few days on gold has been playing into our neutral outlook. However, although the past couple of sessions have seen the bulls ushered to the side-lines, renewed fears of Coronavirus overnight have driven safe haven flow once more. Gold is subsequently testing higher again. Resistance in the $1572 (23.6% Fibonacci retracement of $1445/$1611) and $1577 (Monday’s intraday high) is being tested this morning. However, trading under $1591 (the February high) we see a continuation of what is developing into a multi-week range. For now, we are happy to retain our neutral stance for the near to medium term outlook. The unwinding moves on RSI (still drifting under 60) and MACD (still in a benign drift back towards neutral) backs this too. However, the support over recent weeks has been building at $1546 (around the 38.2% Fib at $1548). The hourly chart suggests the near term importance of the pivot at $1562 which if breached would imply a retreat towards $1546/$1548 again. Hourly momentum has quietened down around neutral points and despite an early tick higher today, the market lacks conviction moving into the European session.
WTI Oil
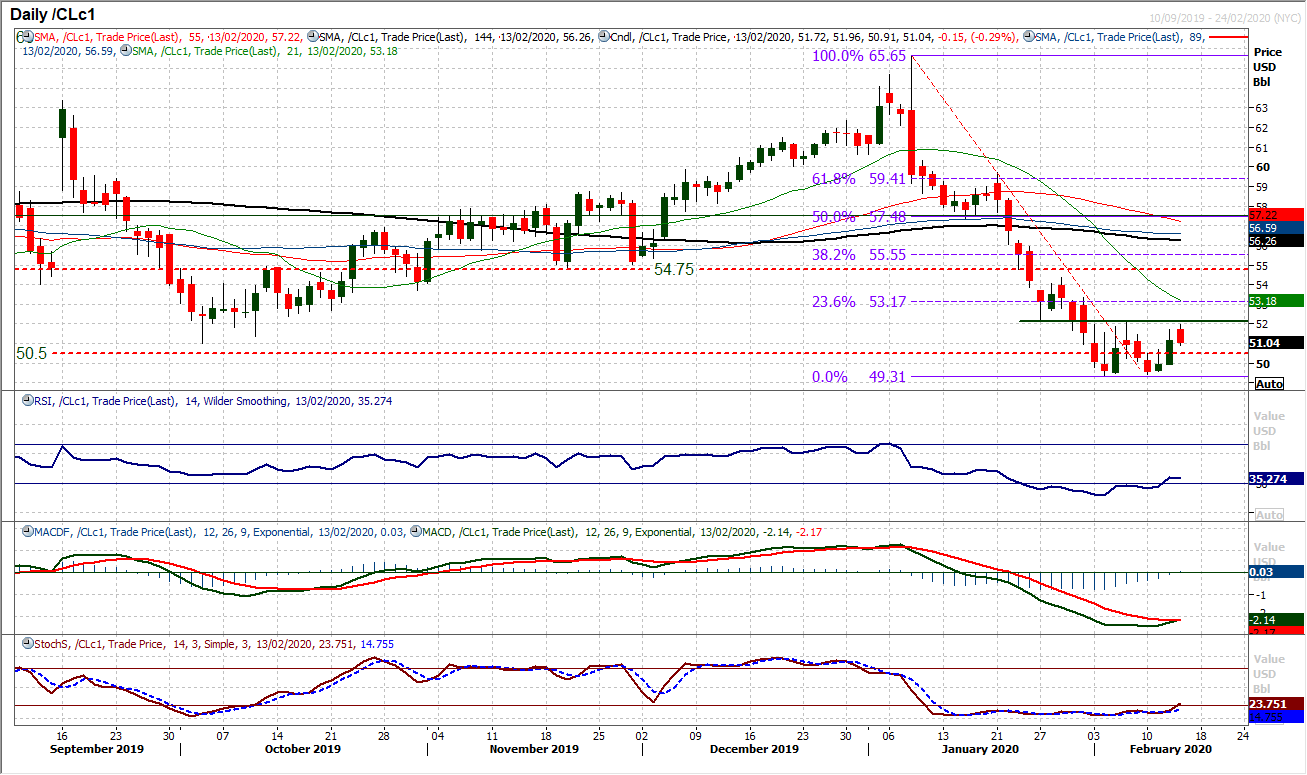
WTI really began to accelerate higher yesterday as the prospects of a sustainable recovery grew. It will be interesting now to see how the market responds to renewed fear of the Coronavirus. Previously, it has brought back decisive renewed selling pressure. The hourly chart shows the near term importance of the support band now at $50.50/$51.00. If this can be held then the bulls will be in a much better position for recovery. A strong move yesterday began to eye the key resistance of a pivot (and potential neckline of a base) at $52.15. whilst the initial look at this resistance did not last long, there seemed to be a more determined positive feel to the market yesterday. Can this now be built upon? Reaction today could be crucial. Losing $50.50 would be a disappointment for the bulls now and re-open $49.30/$49.40 support.
Dow Jones Industrial Average
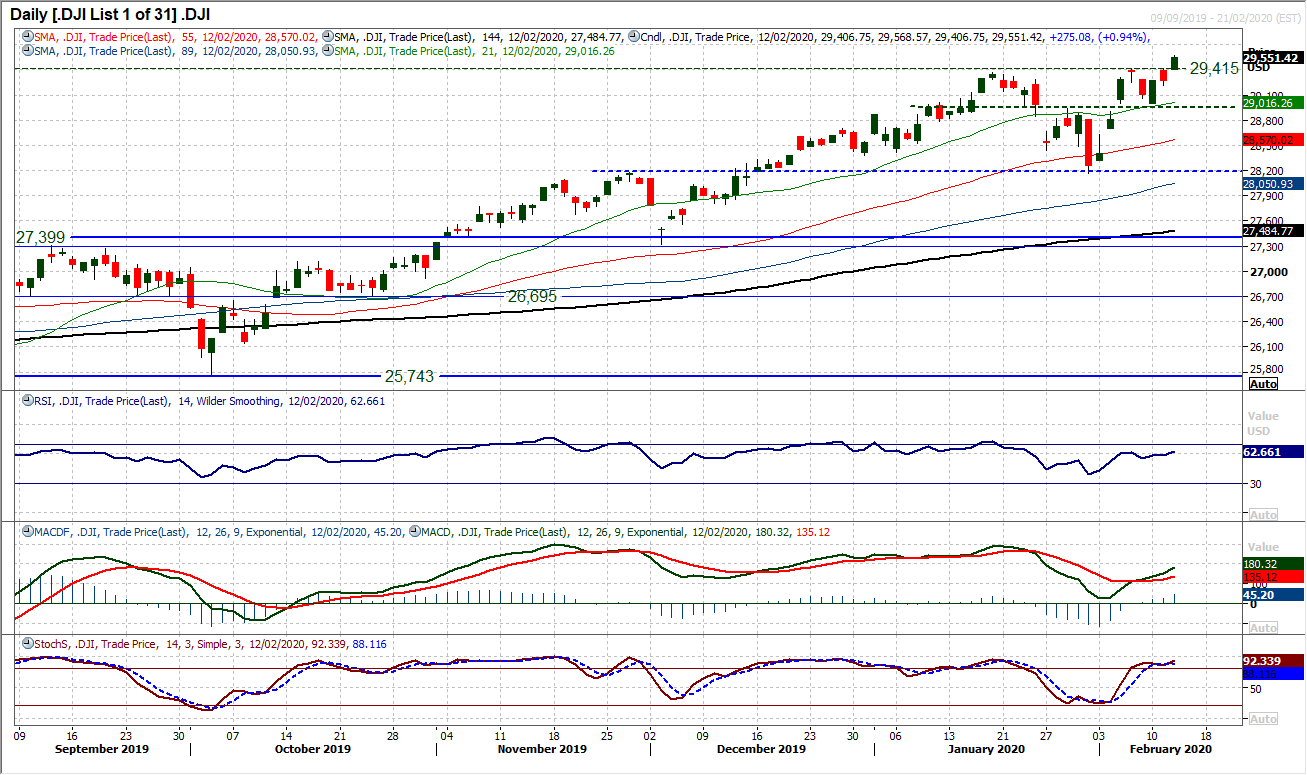
A strong bull candle has finally seen the Dow joining other Wall Street markets in all-time high territory. Closing decisively clear of resistance now opens the way towards 30,000. Momentum is strengthening as the MACD lines accelerate higher, whilst RSI moves above 60 and Stochastics are strong. It means that initial support comes at the old breakout levels 29,375/29,410. However, it also strengthens the support of the pivot band 28,950/29,000 with a key medium term support at 28,170. Near term weakness will be eyed as an opportunity for the bulls and there could be an early pullback today if the futures are anything to go by. Any supported weakness above 29,000 will be a chance to buy.
