Market Overview
There has been a marginal improvement in market sentiment early this week, in moves which begin to pose the thought that a low may have been found in the recent selling pressure. Encouragement has come from the Manufacturing PMIs for January which have tended to come out either less worse than feared (especially in China), marginally better (Eurozone and UK) or encouraging (US ISM). The result has been that traders have managed to look past what is a worsening Coronavirus. The question is, for how long can it again be ignored. In the past few weeks, there have been two or three minor risk rallies, but all have floundered quickly. The virus is spreading by double digit percentages by the day (in terms of the number of cases and also confirmed deaths), but also there are now confirmed deaths coming outside China (in the Philippines and now Hong Kong). For now though, there is an early rebound on bond yields and moves out of safe havens are taking hold. The yen is slipping and the uptrend on gold is creaking. Equities are also showing signs of recovery. These little false dawns have been a feature of recent weeks and there is clearly a big risk. Perhaps watching real world indicators, such as the oil price, or copper will give an indication of a real low in place. For now, the oil price rebound looks very tentative. The Reserve Bank of Australia held fire today on a potential rate cut, keeping interest rates at +0.75% (no change expected, +0.75% last), although a cut in the next few months is still on the table. For now, though the Aussie is reacting positively. However, the same cannot be said for sterling which was hit hard yesterday as the road to a serene trade agreement post-Brexit looks bleak. The stance of UK PM Johnson has hit sterling with further early losses today.

Wall Street closed higher, but well off the highs of the session, with the S&P 500 +0.7% at 3249. However, US futures have continued higher early today, by around +0.6%. This has helped Asian markets find a degree of support with the Nikkei +0.5% and the Shanghai Composite +1.3%. European indices look set for a decent open, with the FTSE futures +0.7% and DAX futures +0.6%. In forex, there is a continued slip on JPY, whilst GBP is an underperformer. The RBA holding firm on rates has allowed a rebound on AUD as the main outperformer. In commodities, there is a mild slip back on gold amidst a cautious risk rebound. The oil price is also up for now by around half a percent.
In a week jam-packed with major data, today is fairly light on the economic calendar. The UK Construction PMI only accounts for around 7% of the UK economy but will be interesting nonetheless, expecting a pick up to 46.6 (from a very concerning 44.4 in December). The US data is primarily focused on the US Factory Orders at 1500GMT which is expected to show growth of +1.2% in December (after a decline of -0.7% in November).
Chart of the Day – Silver
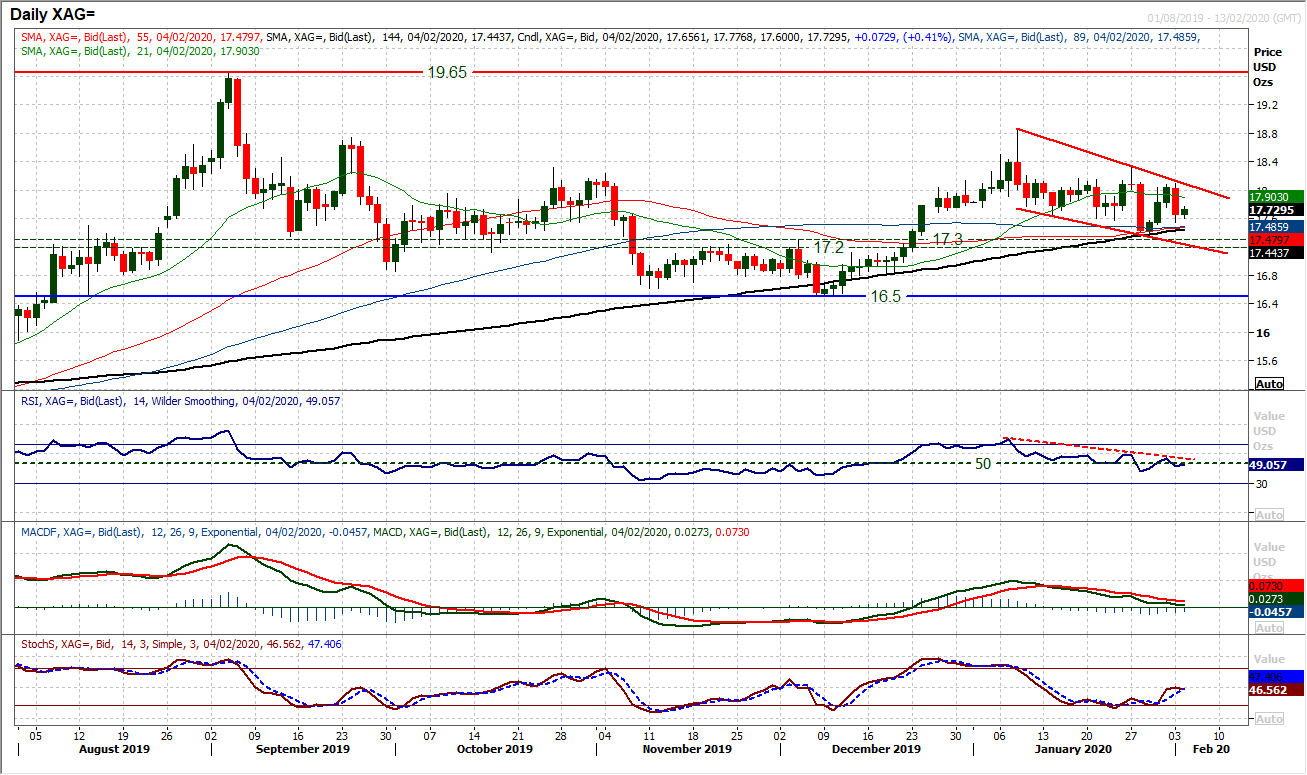
It is interesting to see that whilst gold has spent to past few weeks trending higher, silver has not taken any interest in the move. On the contrary, silver has been forming a downtrend channel over the past three weeks. After again under the resistance $18.15/$18.30, silver formed a bearish engulfing candle yesterday to swing the market back lower once more within the channel. The channel is confirmed by a run of lower highs on the RSI whilst moving back under 50 sees a more corrective outlook forming again. This channel is playing out with what looks to be the building of a test of medium term pivot band support $17.20/$17.30. How the market reacts around this support could now be a defining moment of the medium term outlook. However, despite the deteriorating RSI, momentum does look to be mixed, with the moderating MACD and ticking higher on Stochastics. It is noticeable that whilst trading within a downtrend channel, the outlook for silver remains highly indecisive, lacking trend. Despite this though, using near term rallies towards the $18.00 area as a chance to sell is still the dominant strategy for pressure on $17.20/$17.30.
EUR/USD
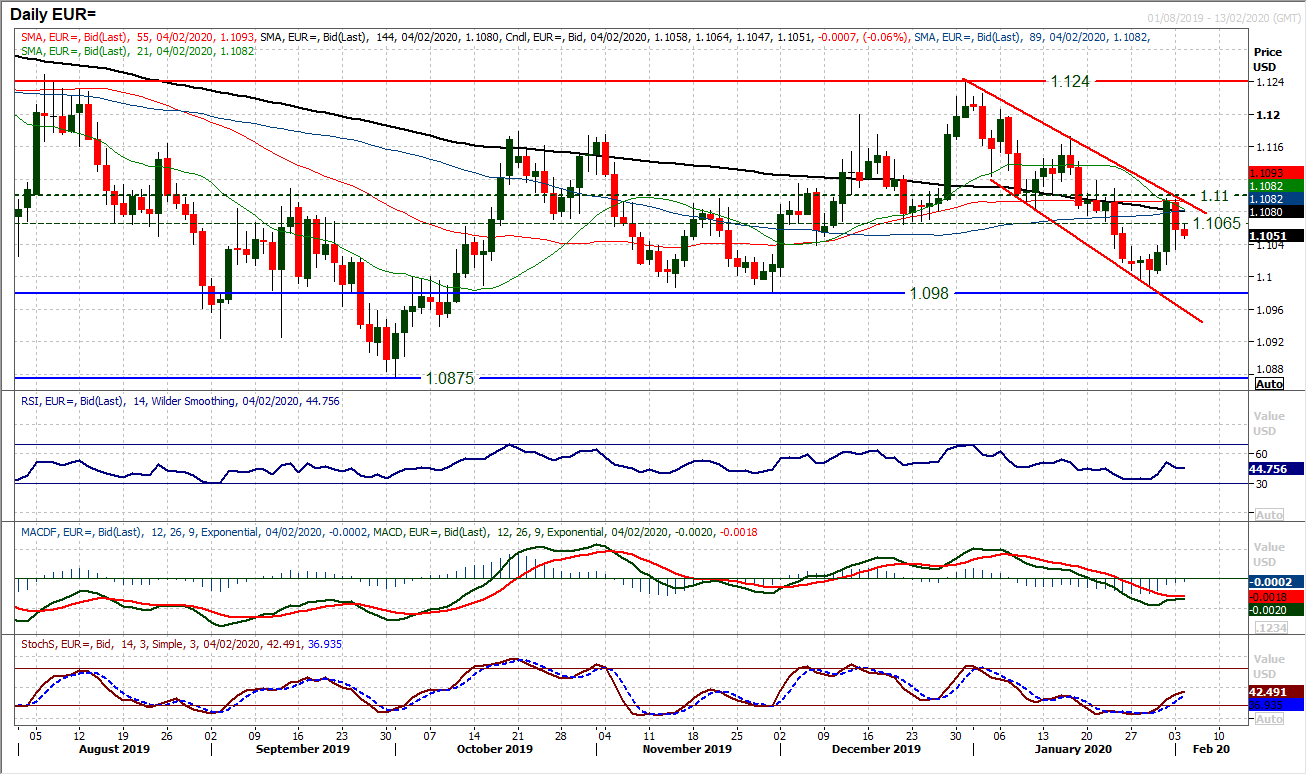
During this time of uncertainty and fluctuating risk appetite, the outlook on EUR/USD continues to drag lower in a multi-week downtrend channel. Last Friday’s sharp rebound had the potential to be outlook changing, but the overhead supply between $1.1065 (old support) and $1.1100 (old medium term pivot and confluence with the channel resistance) have seen the bears resume control again. A bull failure at $1.1095 formed a negative candle yesterday and maintains the corrective outlook. The move has left another lower key high within the downtrend channel and continues the strategy of using rallies as a chance to sell. The euro bulls are not ready to regain control quite yet. Similar to the mid-January rebound, the RSI has faltered again around 50/55 whilst unwinding recoveries on MACD and Stochastics are losing their way. We still see the $1.1065/$1.1100 as a near term sell zone, as a failed recovery is likely to be weighed down again towards $1.1000 and potentially test the key lows $1.0980/$1.0990. Initial support at $1.1035 which is a near term pivot now. A decisive close above $1.1100 would now significantly improve the outlook.
GBP/USD
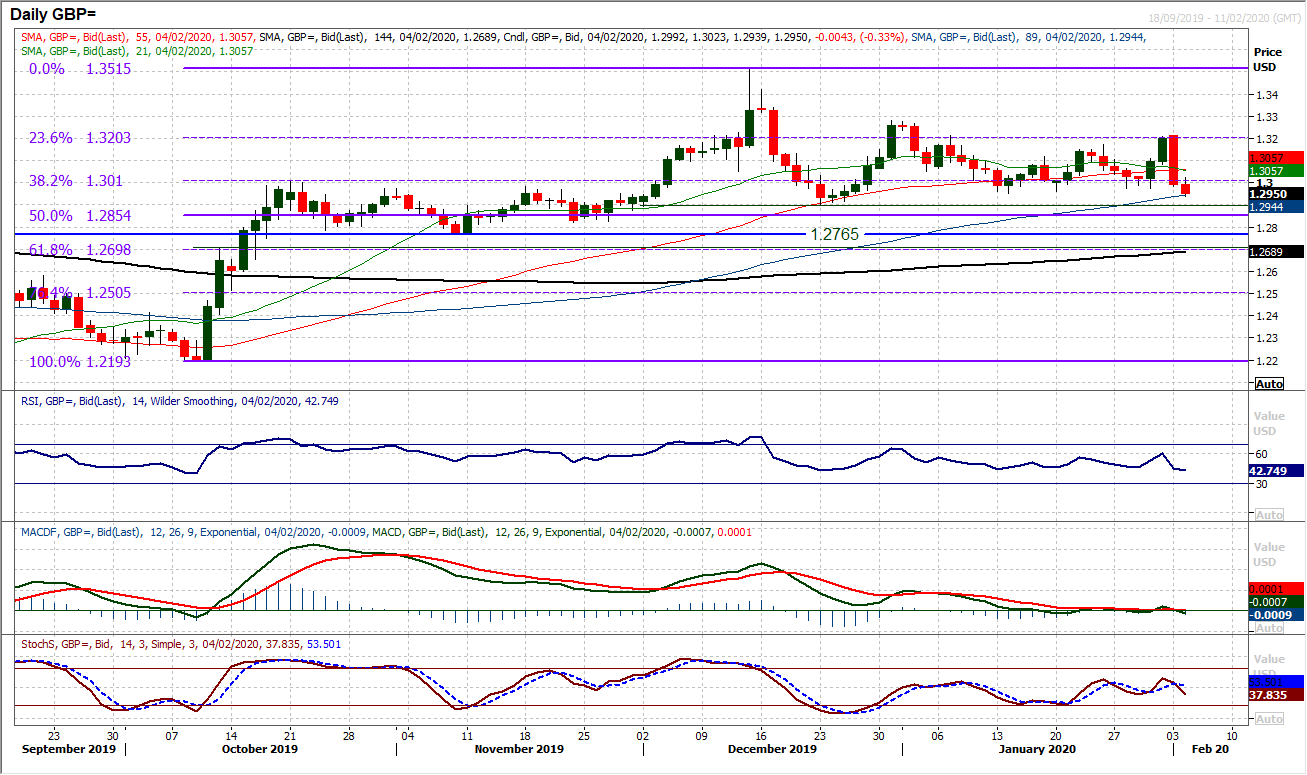
A welcome break from the politics of Brexit ended yesterday as a speech from UK Prime Minister Johnson laid out an initial hard line stance from the UK in trade negotiations with the EU. Sterling was hit hard and fell back around -220 pips versus the dollar. This turned what was an impressive move higher last week completely on its head. However, Cable is back around the $1.2900/$1.3000 support band which, on several occasions in the past month, has been the basis of a floor. This is therefore an important moment for sterling. The move continues what we have been increasingly seeing as an uncertain and indecisive outlook on Cable, but could it be more? An early tick higher in the Asian session has been sold into by the Europeans, now -50 pipis lower on the day. Our strategy that Cable is a buy into weakness is coming under pressure. The technicals are beginning to deteriorate and will do so if the market closes around here. RSI has been oscillating between 45/60 for the past few weeks, but has dropped to a near 4 month low this morning. MACD lines and Stochastics are mixed around neutral. Closing under $1.2950/$1.2960 is a negative signal and we change our positive outlook on a close under $1.2900. Yesterday’s high at $1.3215 is key, and the early resistance is at $1.3025.
USD/JPY
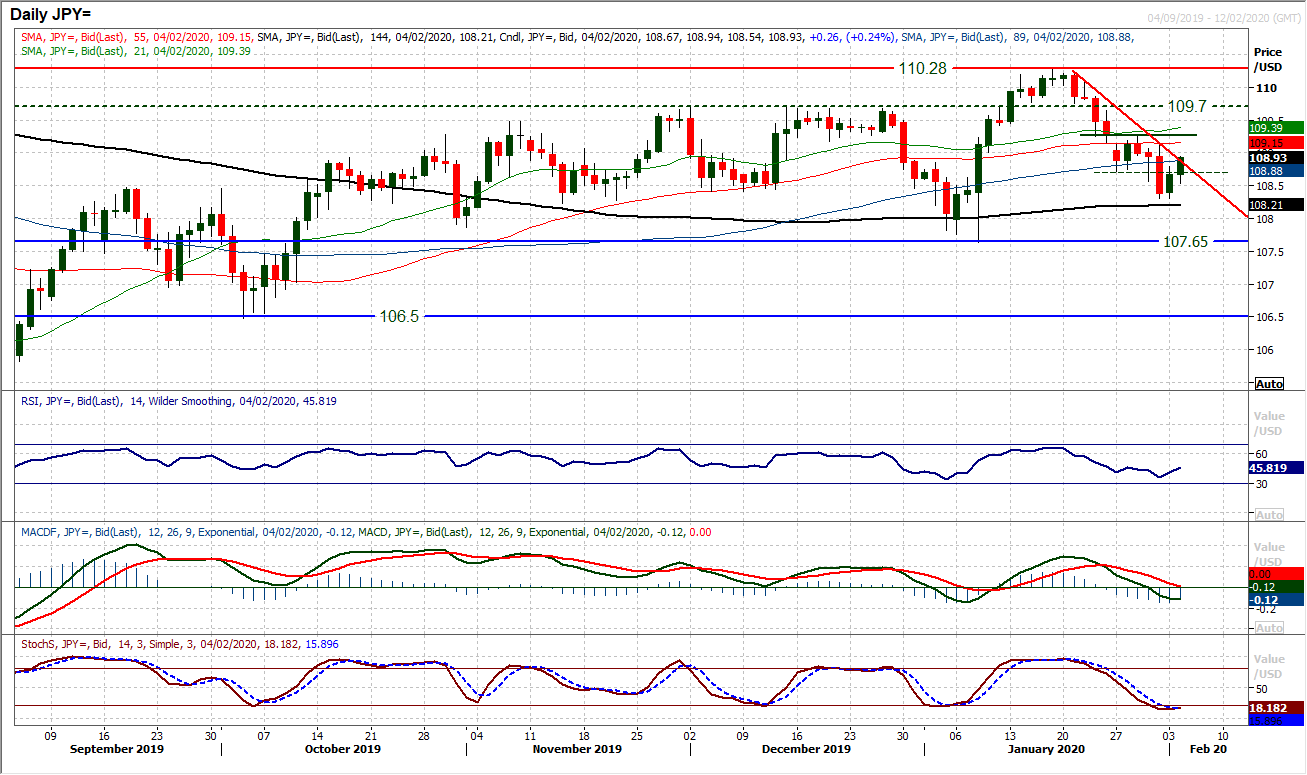
Looking at Dollar/Yen, the question is one of whether we can trust the risk driven rallies yet. If so, then the corrective outlook on USD/JPY will begin to fade and the two week downtrend will begin to break. The trend resistance is at 108.90 today and it is being tested. However, there have not been two consecutive positive candles on a closing basis in more than two weeks now, so if this can be achieved today then it could be the start of something for the bulls. Momentum indicators still edging lower in negative configuration, so given the downtrend being intact, the strategy remains one to sell into strength. However, a positive candle formation today could shift this narrative. The Stochastics are now decelerating in their decline and are back around levels where previous rallies have picked up during these waves of near term bull and bear runs over the past few months. Initial support at 108.30 held yesterday and how the market responds to the near term pivot of resistance around 108.70 and downtrend at 108.90 will be key in today’s session. A close above 108.90 would begin to open a more significant recovery, with resistance at 109.15/109.25.
Gold
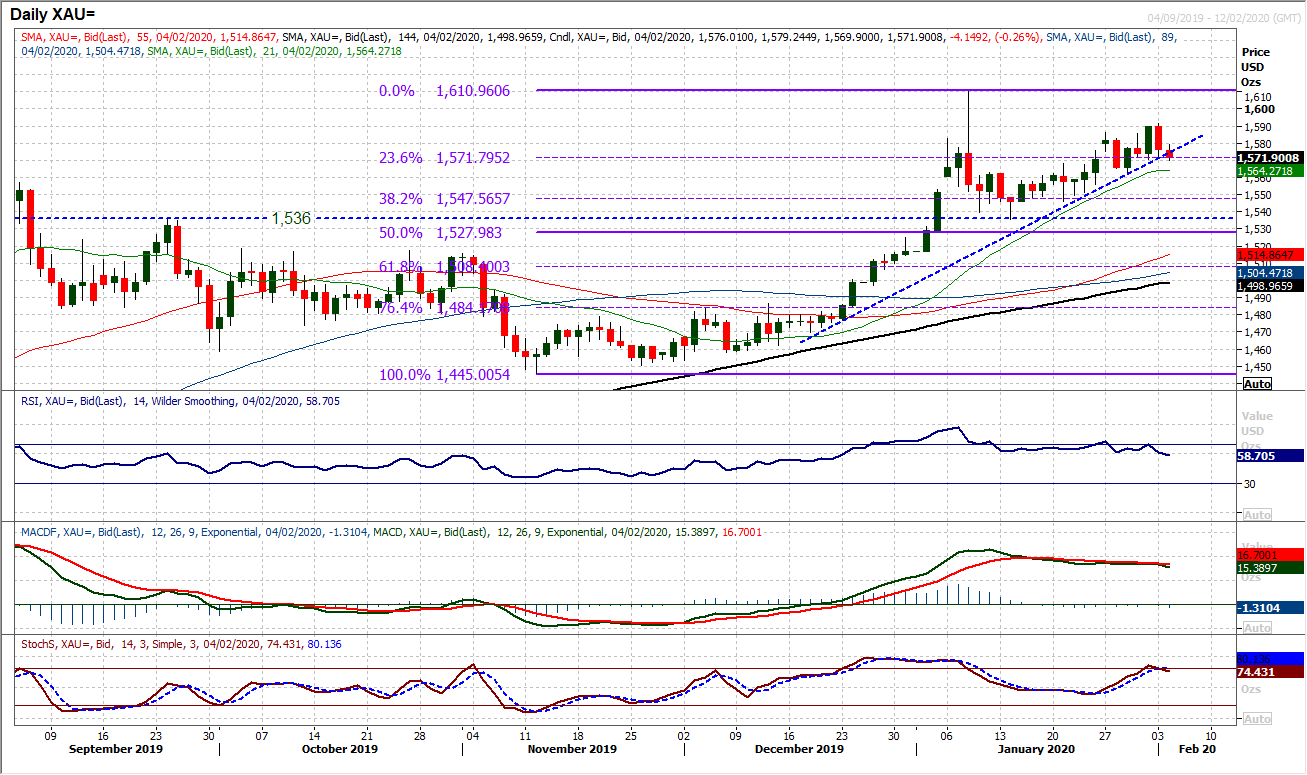
We have been turning increasingly cautious of the rally on gold in the past few sessions. Hugging tight to the uptrend gives the bulls very little room for comfort and the corrective reaction to Friday’s bull candle is a concern. An unwind back yesterday has again slipped lower today and we are seeing an early intraday breach of the uptrend (at $1574 today). The 23.6% Fibonacci retracement around $1572 is a basis of support but the low that the market really needs to watch is at $1562 which is the first real higher low of the bull trend. Momentum also needs to be watched and we have been increasingly cautious in recent days. The MACD lines are still slipping back, whilst if the RSI closes below 60 it would be a six week low (a divergence which is not a good sign in a six week uptrend). The resistance is clear at $1591 (yesterday’s failure high). We are though mindful that the Coronavirus is still very prevalent and is worsening by the day, so simply breaking the uptrend does not mean a renewed corrective move. It is just that the bulls are struggling now.
WTI Oil
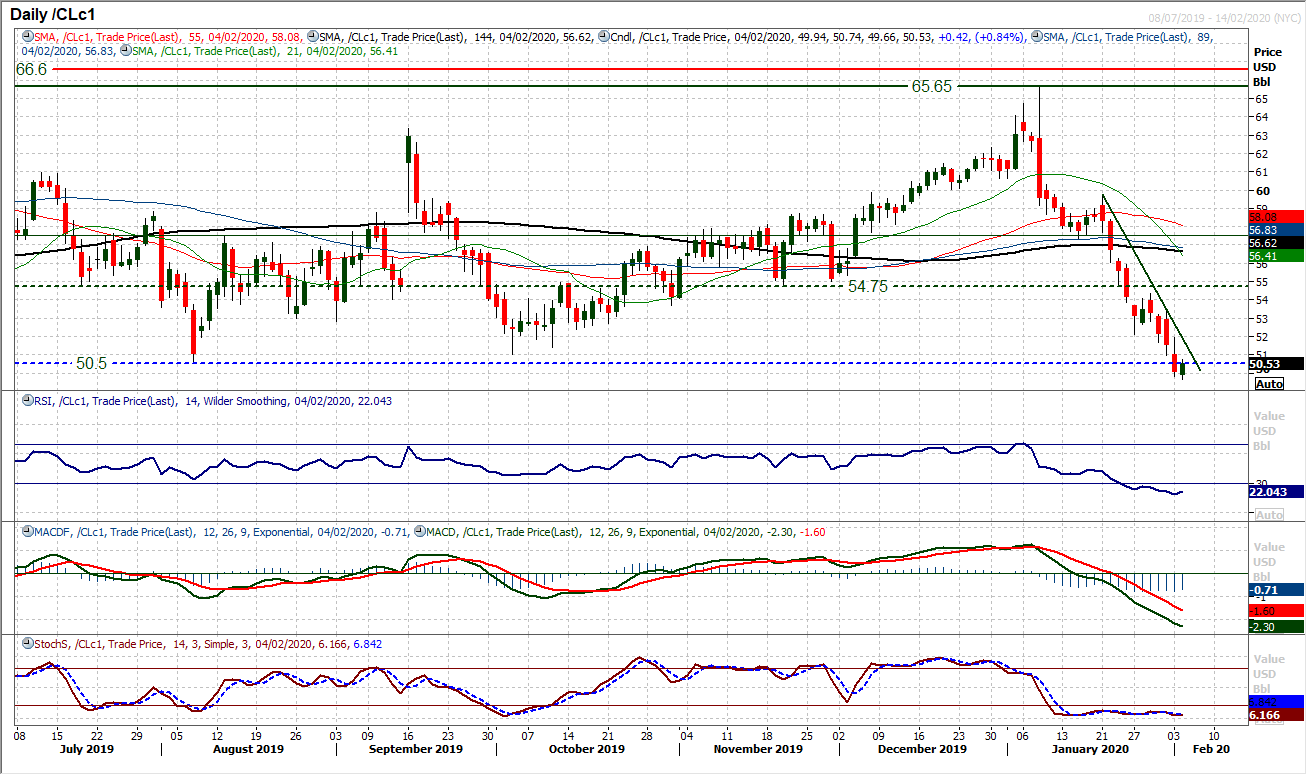
After falling back so precipitously in the past three and a half weeks, traders will be wondering where the floor on the oil price correction is. Throughout the past 12 months, $50.50 has acted as a key floor, but that was broken by yet another sell-off yesterday. WTI marginally avoided closing with a $40 handle, but this selling pressure is significant. On almost a daily basis now, there is initial early hope that a recovery is forming (yet again there has been an uptick in the Asian session), however, intraday rallies are consistently being sold into. Momentum is extremely negative still and the way the market has moved in recent sessions, the prospect of a recovery being sustainable is not great. A two week downtrend comes in at $51.75 today, whilst the hourly chart shows significant near term resistance now around $52.00. A close below $50.00 would realistically open the massive support at $42.00.
Dow Jones Industrial Average
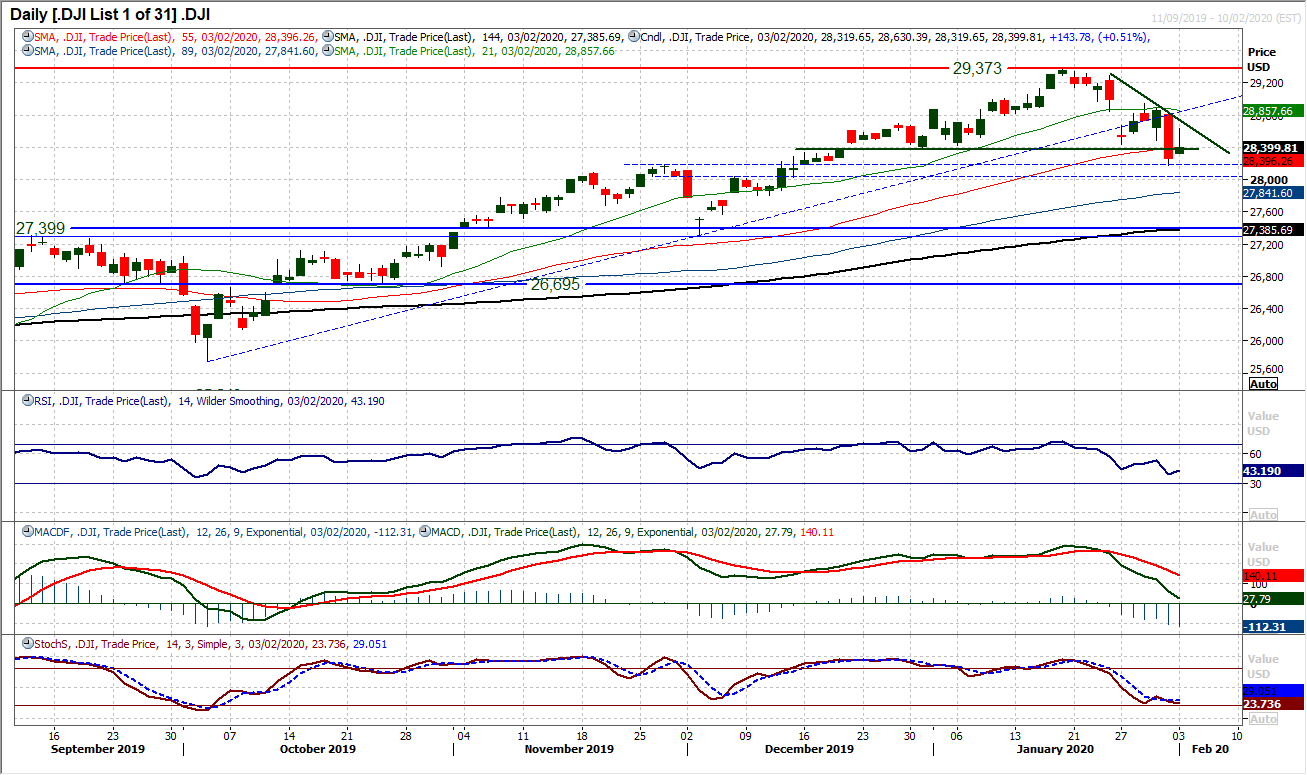
After the breakdown which was seen on Friday, support duly arrived yesterday for the Dow. A rebound of over half a percent, but it could have been much more as the bulls gave up much of the earlier session gains into the close. However, closing back above the neckline of the breakdown at 28,376 was an important first step if the bulls are about to rebuild. The futures are higher again today so once more a positive open is set to be seen, however, the hourly chart shows very much a corrective bias is in play now. The initial resistance to overcome is yesterday’s high at 28,630. On a technical basis, the hourly RSI is now consistently failing between 55/60 whilst hourly MACD is struggling below neutral. All hourly moving averages are also now falling in bear sequence and the 55 hour ma at 28,660 early today is a basis of resistance in the correction so needs to be breached. The risk is that the market is tentative in a rebound (like last week) and quickly the impetus dissipates. Given the shift in sentiment in the past two weeks, this is a likely scenario still, so we play recovery longs with significant caution. The key resistance to break and change the corrective outlook is now 28,944.
