What are candlestick patterns and why should you use them?
Candlestick charts are widely used types by professional traders and have grown in popularity through the late 20th century and into the 21st century. While these candlestick formations are popular and particularly useful in current financial markets, the history of candlestick charts goes back many centuries, to Japan. Candlestick charts were originally created back in the 18th Century by Munehisa Homma, who was a Japanese rice merchant in the Dojima Rice futures market in Osaka, Japan.
Homma realised that by recording the open, close, the high and the low of the market price each day and drawing these as charts, he was able to successfully forecast future price movements. Munehisa Homma was so effective in using his candlestick patterns and charts to trade rice, he became extremely rich and powerful, accumulating a fortune of $100 billion in today’s money.
This is reason enough to respect these candlestick charts and patterns. In addition, many successful traders use candlestick charts today because they deliver dependable and accurate trading signals. These patterns can help improve your trading strategy and also help improve your profits.
In this guide we will look at:
The formation of candlestick patterns
The candlestick chart is similar to the bar chart or Open High Low Close (OHLC) chart, with the main difference being that the area between the open and close is represented by a wider area, described as the “Body” of the candlestick. The narrower, upper and lower lines above and below the “Body” are called the “Shadows”, with the upper “Shadow” described as the “Wick” and the lower “Shadow” is called the “Tail”.
If the difference between the open and close is positive, so if the market moves up in the time frame of the bar, then the wider area is traditionally unfilled or hollowed, and today is often coloured green. If the difference between the open and close is negative if the market moves down in the time frame, then the “Body” is conventionally filled in or is a darkened area, and today is often coloured red.

Now let’s take a look at some common candlestick patterns that we can use in our trading, starting with two basic candlestick patterns that show continuation of a trend. We will then look at a candlestick chart that might signal consolidation, indecision or a lack of directional conviction. And finally, we will explore candlestick charts that might signal a change in direction, four that could signal a bullish shift in direction (from bearish), four that might indicate a bearish shift in direction (from bullish) and one that can be indicate a bullish or bearish shift, depending on the direction of the initial trend. You can also include other support and resistance level.
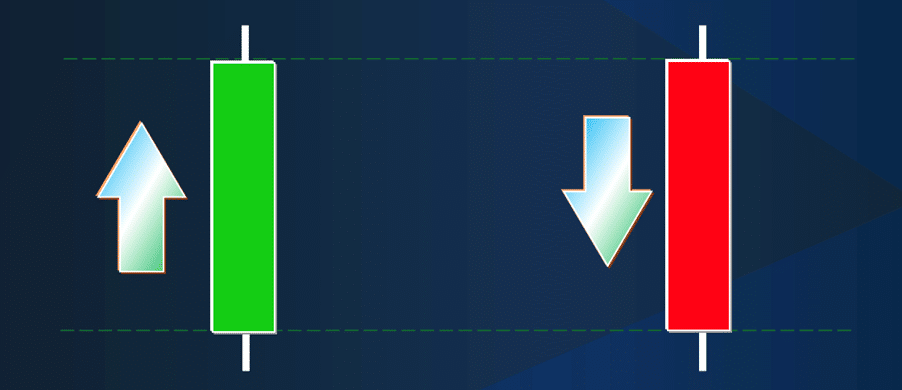
The Standard Line
The Standard Line has a strong “Body”, that is to say, a relatively long body compared to a normal candlestick and relatively small shadows. The Standard Line quite simply indicates a continuation of the current underlying trend in the direction of the Standard Line.
The Marubozu candlestick
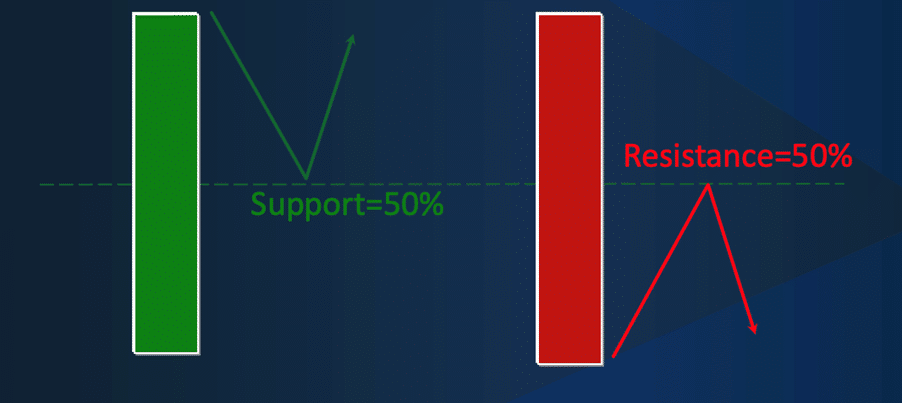
The Marubozu candlestick is similar to the Standard Line but has a much longer, therefore, stronger “Body”, and has no (or very small) upper or lower shadows. Like the Standard Line, the Marubozu candlestick also indicates trend continuation, but a far more forceful continuation signal. If the market retraces in the next bar in the opposite direction to the Marubozu candlestick, the 50% level of the Marubozu candlestick range is seen as initial support or resistance.
Spinning Top patterns
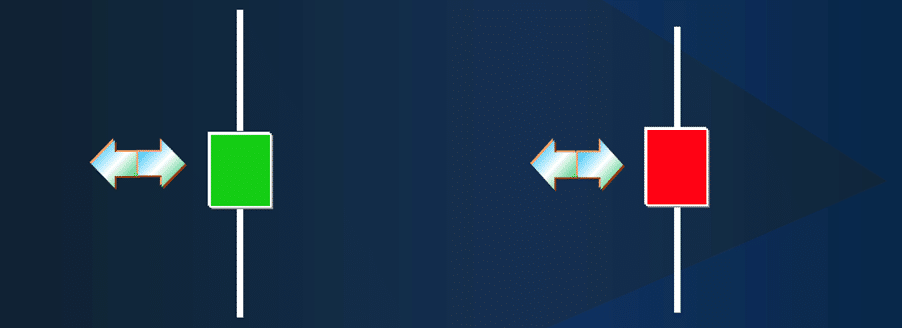
Spinning Top patterns have a very small “Body”, and relatively long shadows at the top & bottom. These Spinning Top patterns are considered neutral candlestick patterns that might signal consolidation, indecision or a lack of immediate directional conviction.
We are now going to look at four candlestick charts that might signal a bullish shift in direction from bearish.
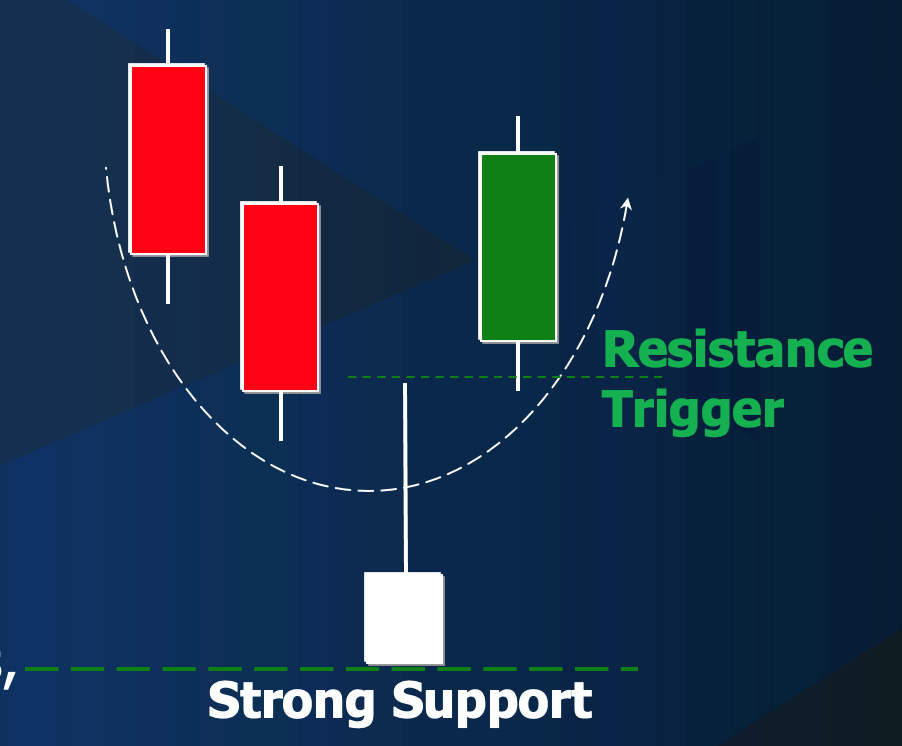
The Hammer candlestick
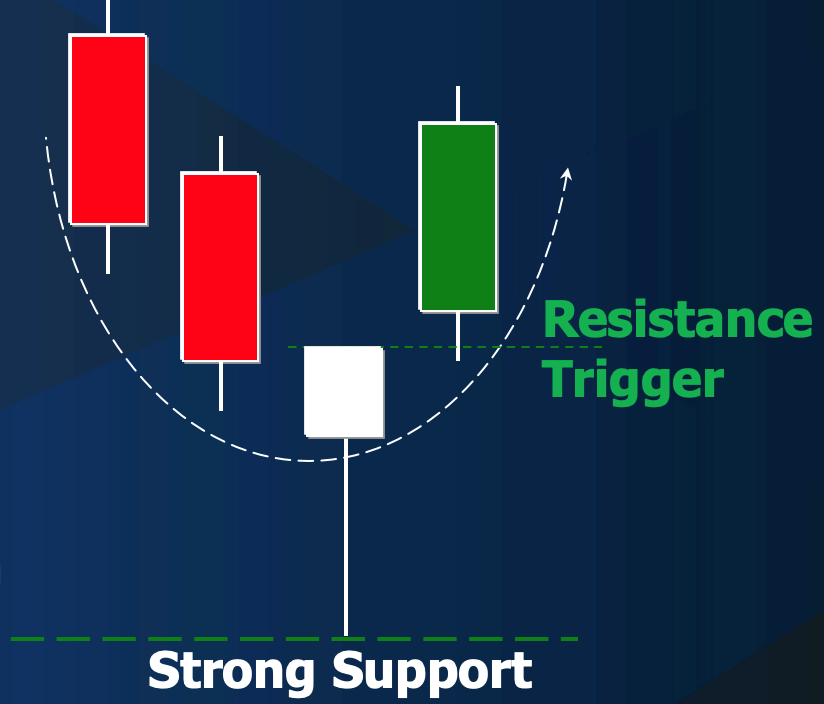
The Hammer candlestick pattern is formed in a prior downtrend. When forming the Hammer candlestick, the market dips and rebounds to close significantly above the low, closing near to or at the high of the candlestick. The confirmation of the Hammer candlestick is signalled by a close above the Hammer candlestick high in the next 1-2 candlesticks, to indicate a reversal of the prior downtrend.
The Dragonfly Doji candlestick
The Dragonfly Doji is very similar to the Hammer candlestick, but the difference between the open and close is very small or at the same price, meaning there is either a very small or no “Body”. As with the Hammer candlestick, a close above the Dragonfly Doji high is required in the next 1-2 candlesticks in order to confirm a reversal of the prior downtrend.
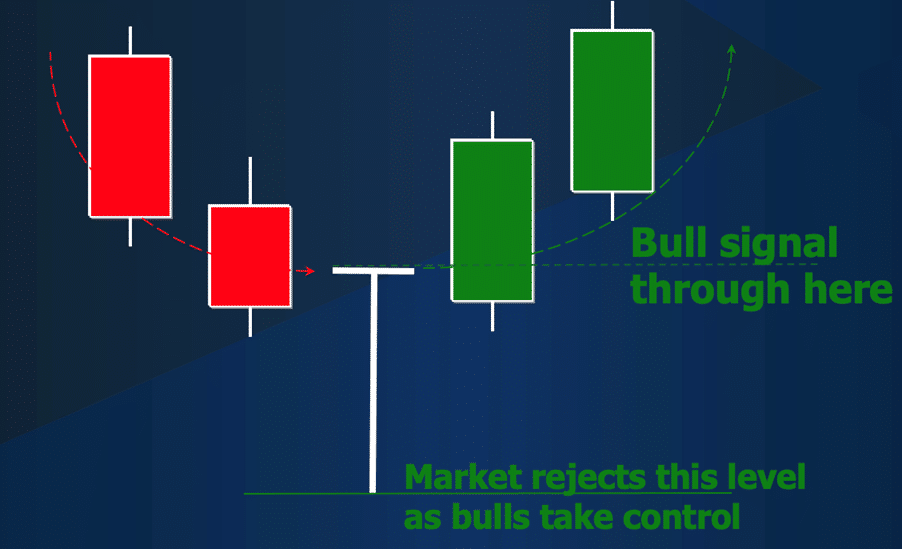
The Inverted Hammer candlestick
The next potentially bullish candlestick is the Inverted Hammer, which is an upside-down version of the Hammer that occurs in a prior downtrend. During the formation of the Inverted Hammer candlestick, the market pushes lower then rebounds and then fails back lower again, to close significantly below the high, near to or at the low. But the market still has quite some work to do to signal a bullish shift, needing to close above the Inverted Hammer candlestick high in the next 1-2 candlesticks to signal a bullish shift in trend.
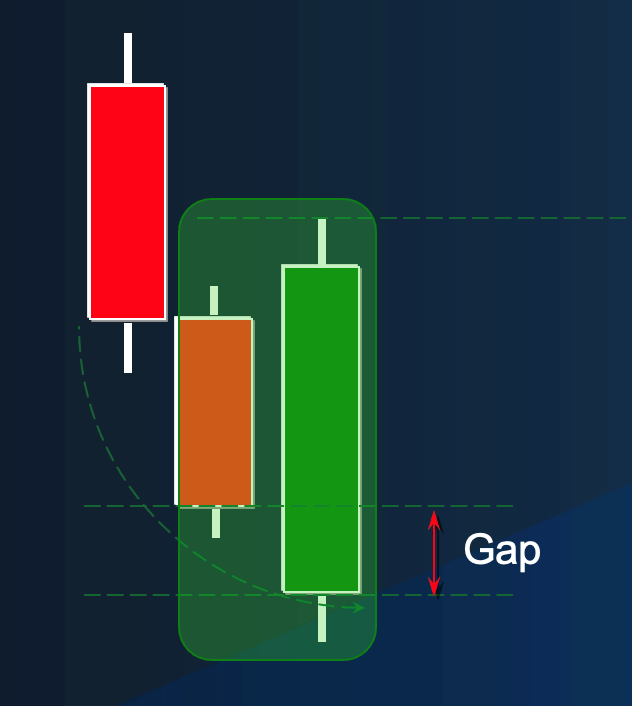
The Bullish Engulfing candlestick
The Bullish Engulfing candlestick is a strong bullish reversal pattern and is sometimes called a key reversal pattern. It signals a significant shift in directional sentiment from bearish to bullish. A prior downtrend is required and during the formation of the Bullish Engulfing candlestick the market gaps down. The market then rallies up to close above open of the previous candlestick. Therefore, the bodies of the two candlesticks are opposite in direction and colour, from red to green and the Bullish Engulfing candlestick, “engulfs” the previous candlestick, has a lower open and a higher close. In this case, the upper and lower Shadows are not important.
We are now going to shift the focus to four candlestick charts that might signal a bearish shift, from a bullish trend.
The Shooting Star candlestick
The Shooting Star candlestick requires a prior uptrend. During the formation of this candlestick, the market rallies and fails back lower to close significantly below the high. The Shooting Star candlestick has a long upper Wick and very small or no lower Tail, and a relatively small Body, preferably with a lower close, so a red Body. A close below the “Shooting Star” candlestick low in the next 1-2 candlesticks confirms a reversal of the prior uptrend to bearish.
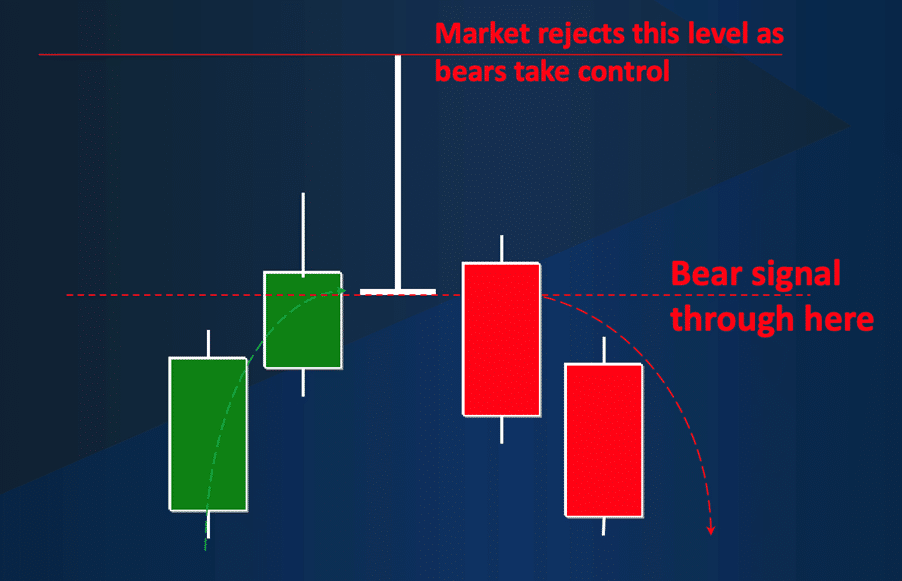
The Gravestone Doji candlestick
A Gravestone Doji is very similar to a Shooting Star candlestick, through in the case of the Gravestone Doji the difference between the open and close is very small or at the same price, meaning there is either a very small or no Body. As with the Shooting Star candlestick, the Gravestone Doji has a long upper Wick and very small or no lower Tail. And again, a close below the Gravestone Doji low in the next 1-2 candlesticks confirms a reversal of the prior uptrend.
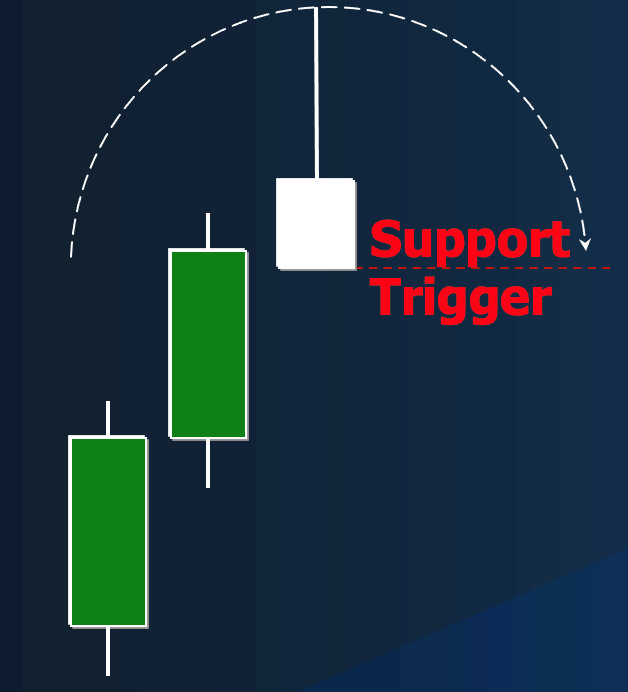
The Hanging Man candlestick
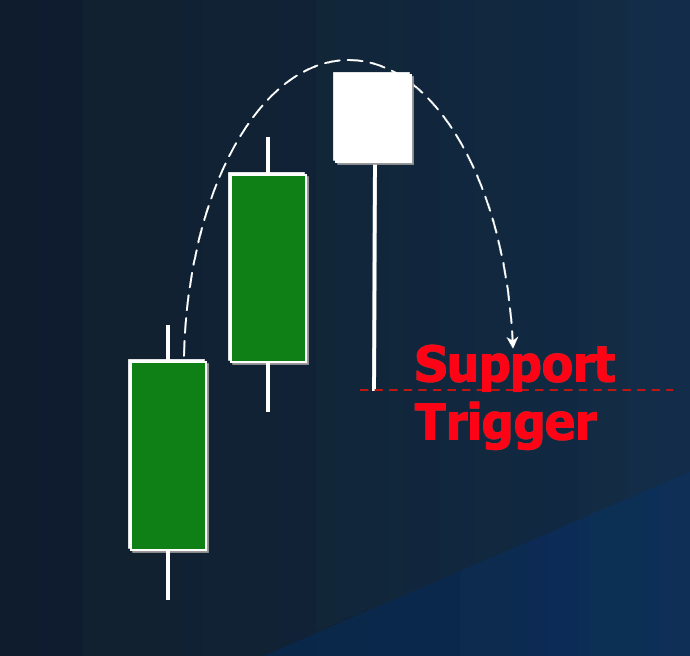
The next possibly bearish candlestick pattern is the Hanging Man candlestick, which is an inverted version of the Shooting Star candlestick pattern, that occurs in a prior uptrend. During the formation of the Hanging Man candlestick the market pushes higher than sets back and then rebounds back higher again, to close significantly above the low, near to or at the high. The Hanging Man candlestick has a small Body and relatively long lower Tail, with a small or no upper wick. However, to signal a bearish shift the market still has some more work to do, needing to close below the Hanging Man candlestick low in the next 1-2 candlesticks to signal a bearish shift in the trend.
The Bearish Engulfing candlestick
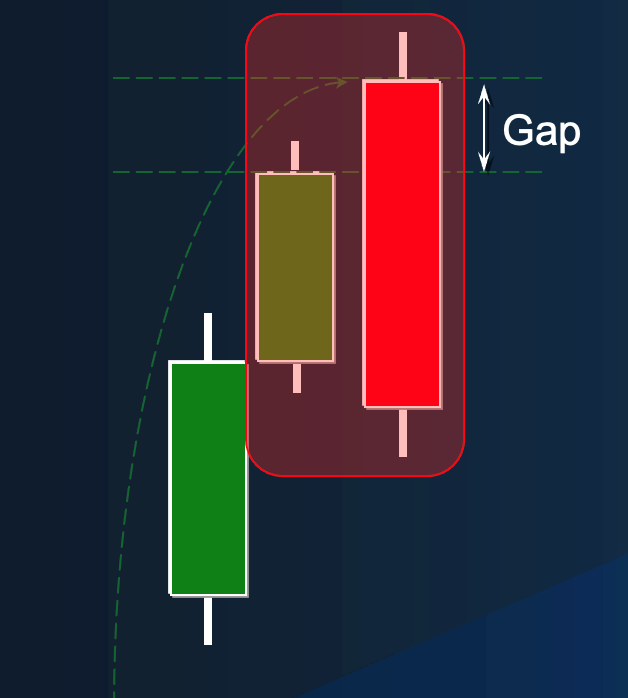
The Bearish Engulfing candlestick is the opposite of the Bullish Engulfing candlestick and is a strong bearish reversal pattern and often called a key reversal pattern. It signals a significant shift in directional sentiment from bullish bearish to. A prior uptrend is required and during the formation of the Bearish Engulfing candlestick the market gaps up. The market then sells off to close below the open of the previous candlestick. Therefore, the bodies of the two candlesticks are opposite in direction and colour, from green to red and the Bearish Engulfing candlestick, “engulfs” the previous candlestick, that is to say, has a higher open and a lower close. Again, as with the Bullish Engulfing candlestick, the upper and lower Shadows are not particularly important.
The Long-Legged Doji candlestick
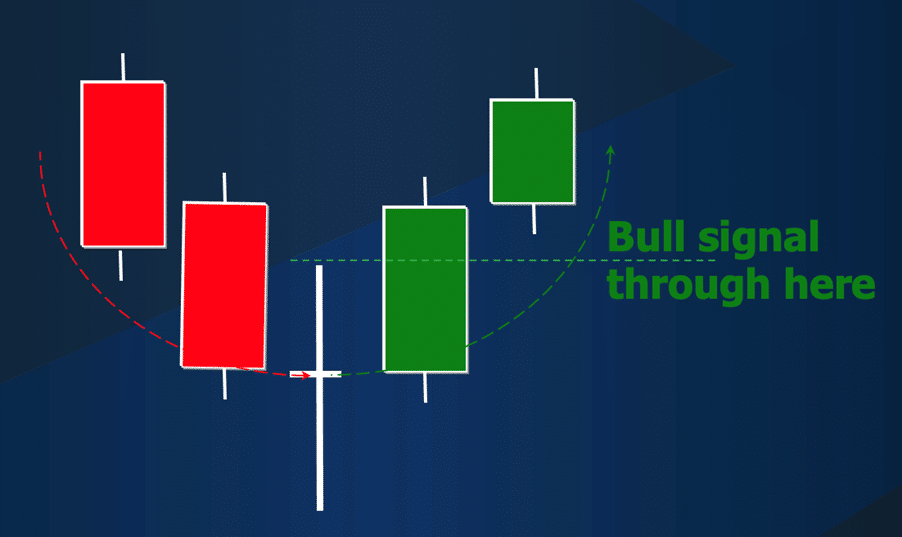
A Long-Legged Doji candlestick is a candlestick pattern that can be bullish or bearish, it simply signals a reversal of whatever the prior, underlying trend is. The Long-Legged Doji has a very small or no Body and long upper and lower shadows, of similar length. This candlestick pattern indicates a potential turning point, from bullish to bearish in an uptrend, or bearish to bullish in a downtrend. Confirmation of a trend shift is signalled in the following 1-2 candlesticks but a push below the Long-Legged Doji candlestick low in the uptrend. A bullish reversal is indicated on a move above the Long-Legged Doji high in a downtrend, in the following 1-2 candlesticks.
A Summary of Candlestick Patterns
We have looked at various single and double candlestick patterns, that indicate either trend continuation, indecision or consolidation and also bullish or bearish trend reversals. Whether you are a day trader, a position or swing trader or employ other trading strategies you should be able to incorporate candlestick patterns to help you with entering or exiting trades. These patterns can also help with taking profits on open positions. Below is a summary of the different candlestick formations we have looked at and whether they indicate continuation, reversal or indecision, plus if they are bullish or bearish.
| Candlestick Pattern | Continuation, Reversal, Indecision | Potentially Bullish or Bearish |
|---|---|---|
| Standard Line | Continuation | Bullish or Bearish |
| Marubozu candlestick | Continuation | Bullish or Bearish |
| Spinning Top patterns | Indecision | Neither |
| Hammer candlestick | Reversal | Potentially Bullish |
| Dragonfly Doji candlestick | Reversal | Potentially Bullish |
| Inverted Hammer candlestick | Reversal | Potentially Bullish |
| Bullish Engulfing candlestick | Reversal | Potentially Bullish |
| Shooting Star candlestick | Reversal | Potentially Bearish |
| Gravestone Doji candlestick | Reversal | Potentially Bearish |
| Hanging Man candlestick | Reversal | Potentially Bearish |
| Bearish Engulfing candlestick | Reversal | Potentially Bearish |
| Long-Legged Doji candlestick | Reversal | Potentially Bullish or Bearish |
