Market Overview
After days of negotiation, Congressional leaders and the White House have seemingly agreed to the delivery of a fiscal relief package of $2 trillion to help the US economy through the biggest economic shock since the 2008 financial crisis. Markets were quick to respond to the prospect of this yesterday driving Wall Street to its largest one day rally for many years. The question is whether this move is just “buy the rumour, sell the fact”. Traders still have no clarity on the true financial impact of the Coronavirus on the world economy, and may be still reluctant to support risk assets even at these massively depressed levels. Despite this, there is still a positive bias to markets today. This is driving the US dollar lower (USD was a huge safe haven as the market plunge took hold recently). Equities look supported again today, but it is way too early to determine whether this is now “the” low in place. One market that is interesting to watch is that Treasury yields have begun to settle. The wild swings lower and higher throughout March beginning to see reduced volatility can reflect a degree of stability returning to markets and able to support risk appetite once more. It is not all good news this morning though, as the Eurozone finance ministers failed to agree on the use of the European Stability Mechanism (the ESM) as an extra form of support for countries. The old divisions of northern/southern European economies playing out once more is not too encouraging in this time of need.

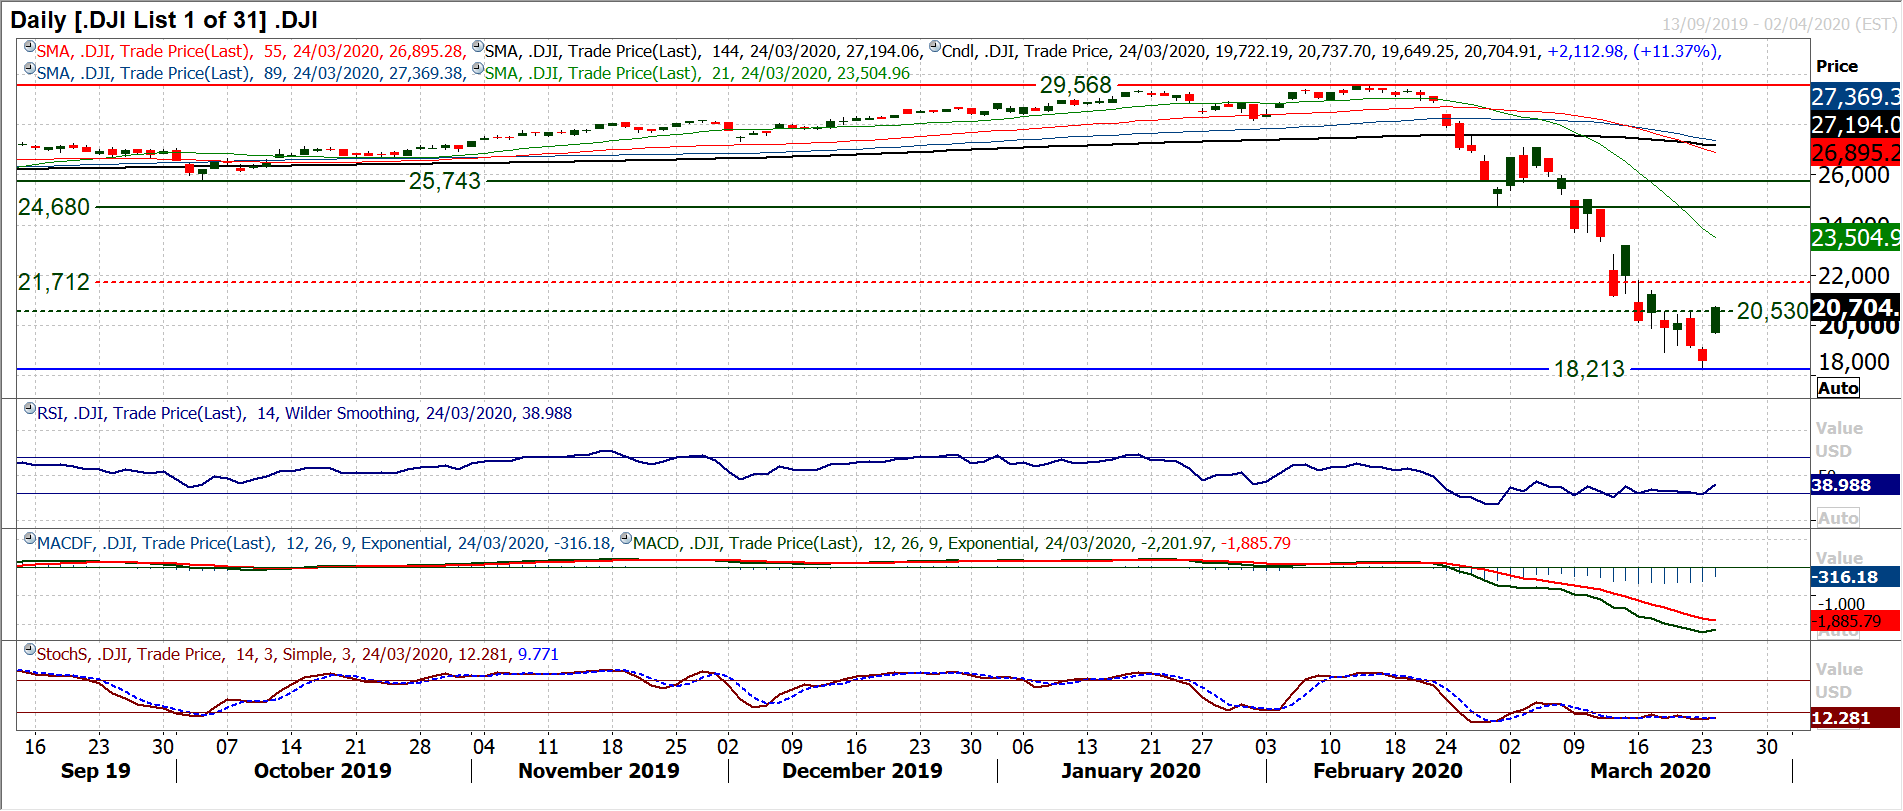
Wall Street closed with record gains last night. The Dow had its biggest one day rally since 1933 (+2112 ticks, or +11.4%), whilst the S&P 500 was +9.4% higher at 2447. US futures are mildly higher early today by +0.8% currently. Asian markets have reacted strongly overnight with the Nikkei +8.0% and Shanghai Composite +2.2%. Chinese equities outperformed on the way down, and are beginning to underperform on the way back up again. In Europe, the outlook is again strong with FTSE futures +3.0% and DAX futures +3.0%. In forex, there is a risk positive bias, with AUD and NZD again outperforming, whilst GBP (which had been slammed recently) also performing well. The safer end of the spectrum (JPY, CHF and USD) currencies are laggards. Commodities are taking a more traditional pattern of risk. Gold is slightly lower, silver slightly higher whilst oil is around 3% higher.
Data announcements continue to play second fiddle to Coronavirus responses from politicians and central banks, however, there are still some indications of how economies are reacting. Mostly they are absolutely terrible, but still they could drive some intraday volatility so we need to keep an eye on the calendar. German final Ifo Business Climate for March is at 0900GMT and is expected to be unrevised at 87.7 (from 87.7 last week, which would be down from 999.0 in February). US data comes in the form of US Core Durable Goods Orders (ex-transport) at 1230GMT which is expected to fall by -0.4% in February (after an increase of +0.8% in January). The Weekly EIA Crude Oil Inventories are at 1430GMT and are expected to show stocks increasing by +2.9m barrels last week (after a build of +2.0m barrels the week before. That would be a ninth consecutive week of stocks building.
Chart of the Day – EUR/JPY
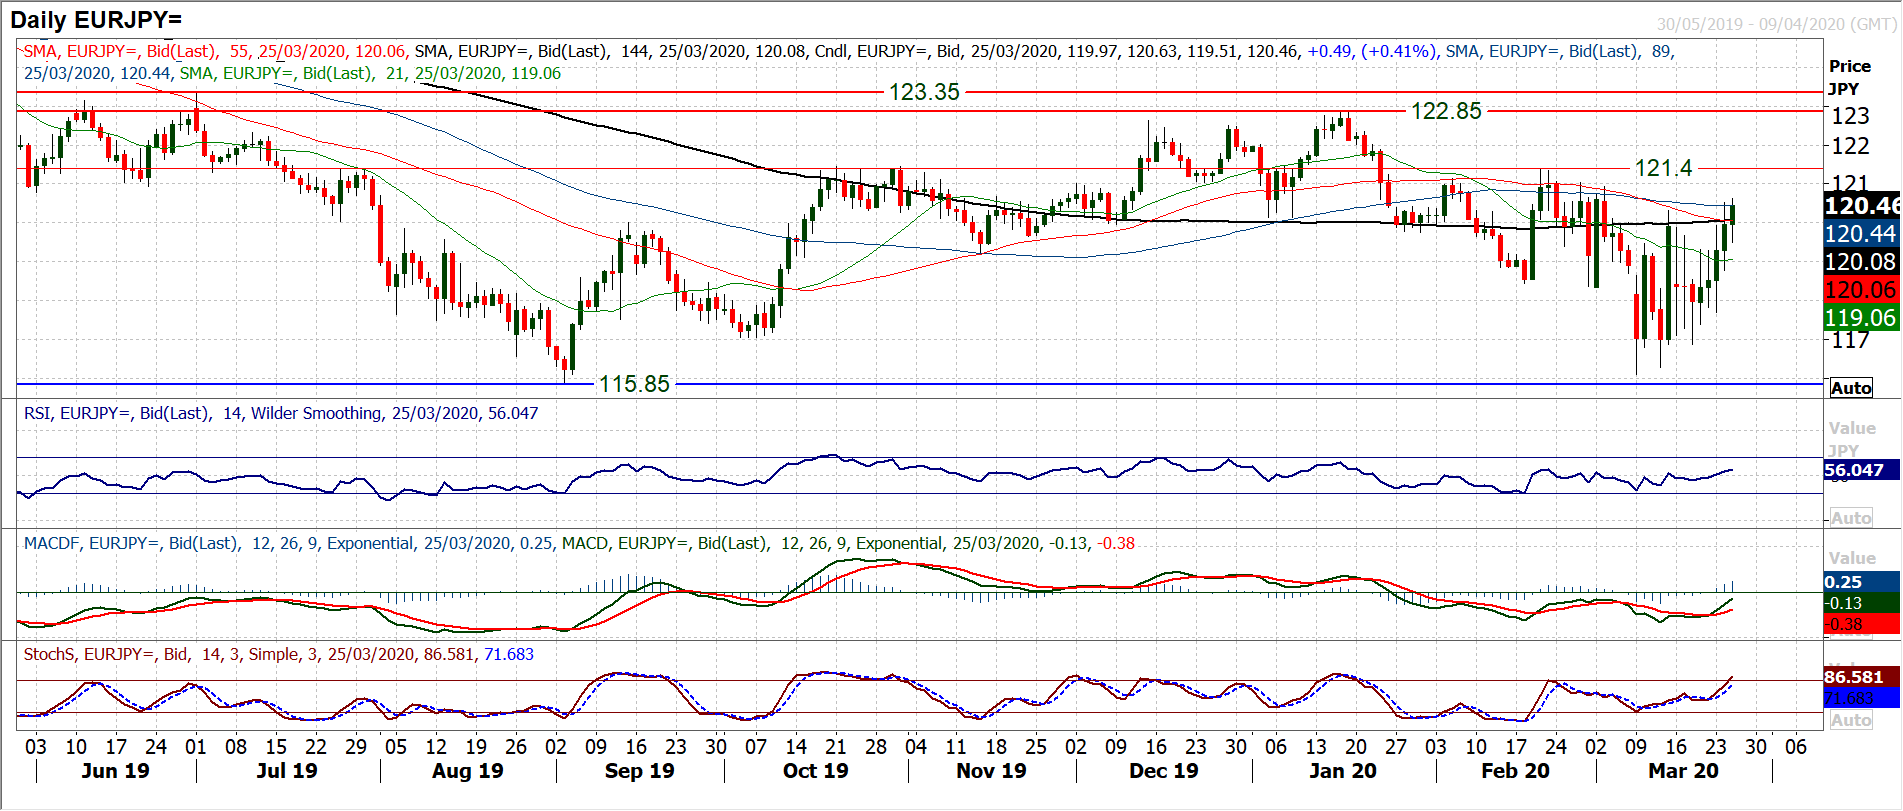
It has been a remarkably choppy period for Euro/Yen but is there finally starting to be a bit more clarity on market direction? The past two weeks has been racked with volatility with huge swinging candles but little direction. However, there have now been four positive closes in a row for the pair and a move to a two week high. This move is coming with momentum indicators starting to pull higher, with Stochastics now rising at multi-week highs and MACD lines also finding upside traction. The RSI pulling above 60 (which would be a two month high) would be a good indication of a growing bull move. The market seems to be positioning for a test of the resistance from February and early March highs between 121.00/121.40 which stand in the way of a pull higher to the January high at 122.85. The hourly chart shows support initially today at 119.50 whilst the bulls will be looking in the driving seat whilst the support band 118.80/119.30 remains intact. Intraday weakness is now a chance to buy.
EUR/USD
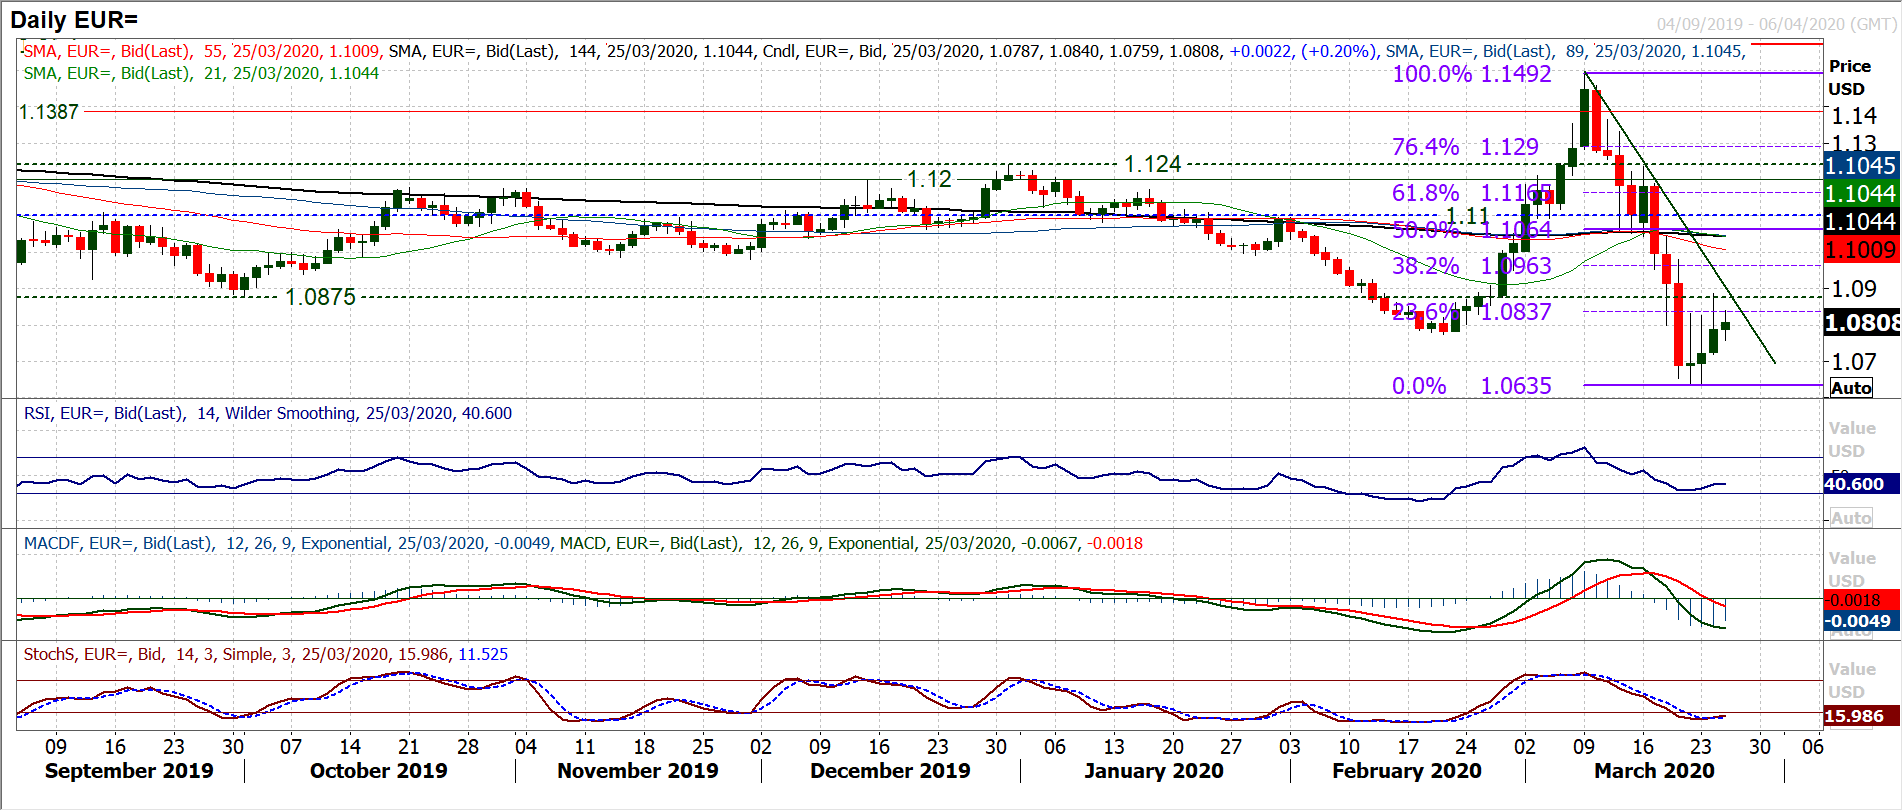
Although a false breakout of a small base pattern has just pulled the reins on the bulls hankering for a recovery, the recovery potential is still developing. The market closed decisively higher on the day, and even though the bulls gave up a large chunk of earlier gains to leave a slightly spluttering positive candlestick, this was a third consecutive positive close and the market is again looking positive today. We are still looking for a close above the 23.6% Fibonacci retracement (of $1.1492/$1.0635) at $1.0835 to be confirmation of a decisive recovery, but for now this is still a move to be seen with caution. Momentum reflects this, with Stochastics in the process of bottoming (but no confirmed bull cross yet), whilst RSI is ticking higher but not yet decisively. The resistance of a two and a half week downtrend comes in at $1.1900 today, whilst the hourly chart shows resistance between the old $1.0830 breakout and yesterday’s $1.0885 high. Hourly momentum is still encouraging though, with RSI consistently above 40 and MACD positive. The bulls will be looking to hang on to $1.0745 as a basis of support, whilst a move back below the higher low at $1.0720 aborts the recovery. To maintain the rebound potential, a close above $1.0830 is needed now.
GBP/USD
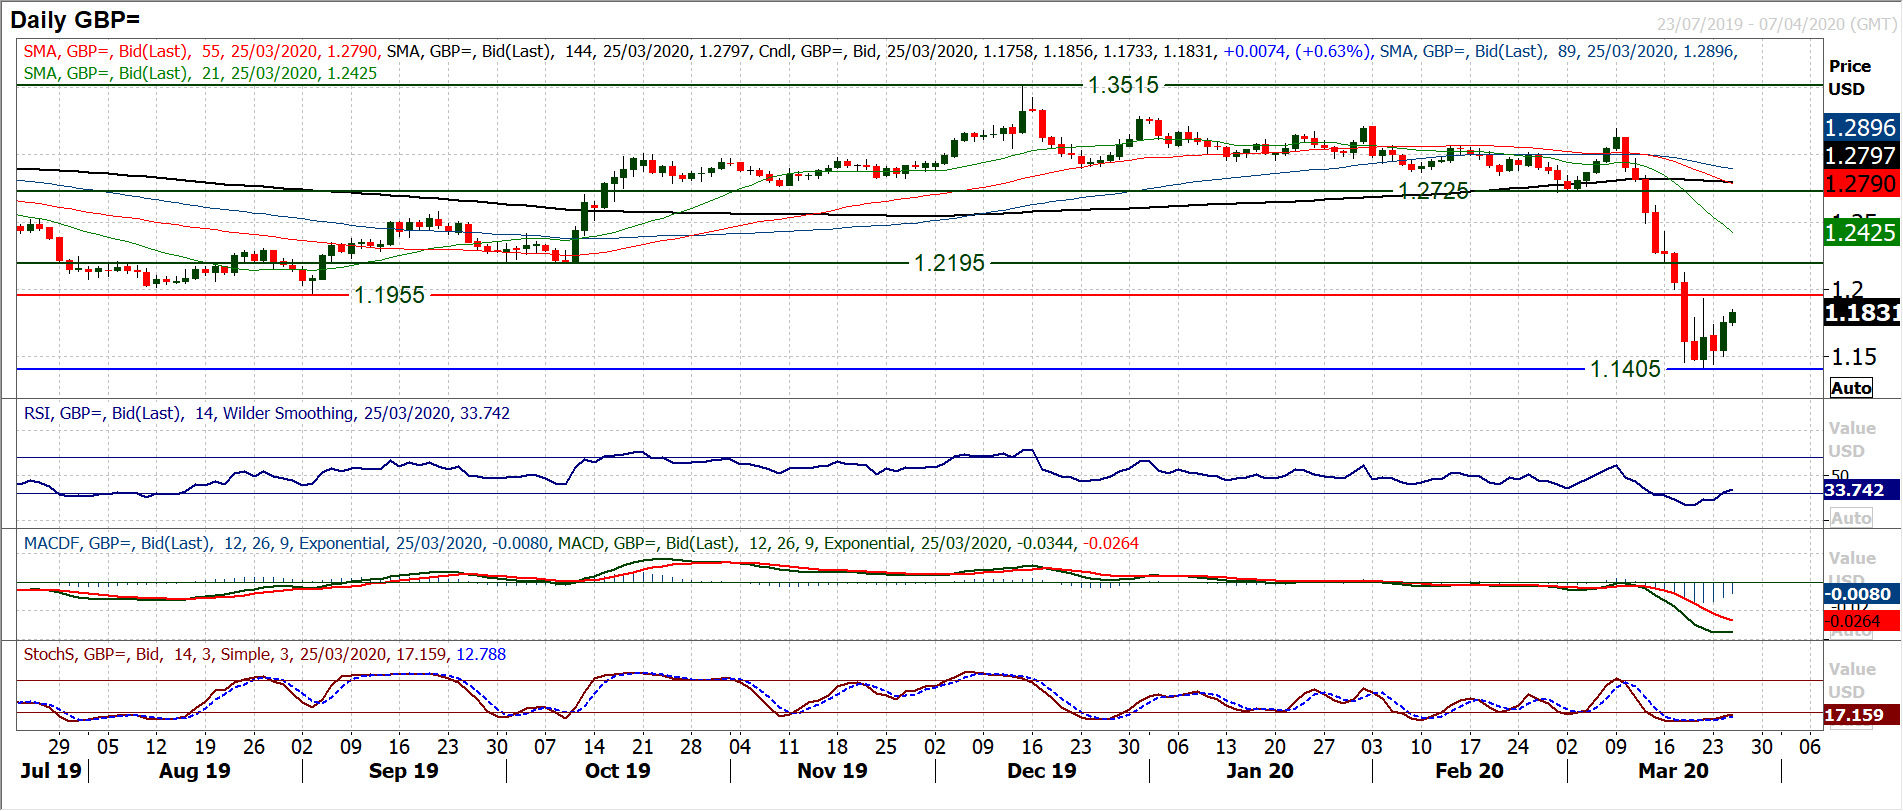
It looks as though the building blocks of a sustainable rebound in sterling are being laid now. The precipitous sell-off has been quelled with a low left at $1.1405 and positive candles are being formed. This is helping to pull momentum indicators higher, with the RSI crossing back above 30 from a record low of 16. The hourly chart shows how the market is increasingly encouraging now, with positive configuration to momentum (RSI consistently above 40 and pushing 70, whilst MACD and Stochastics are positive. What is effectively a 525 pip base pattern is forming. Usually this depth of pattern would take weeks, but this is over the course of just five days so far. So the bulls will be eyeing resistance at $1.1930 which if breached on a closing basis would imply a significant improvement in outlook. There is a basis of initial support forming at $1.1680/$1.1700 but there is little resistance until $1.1930. The daily chart then shows overhead supply between old key lows of $1.955/$1.2195 as potential resistance.
USD/JPY
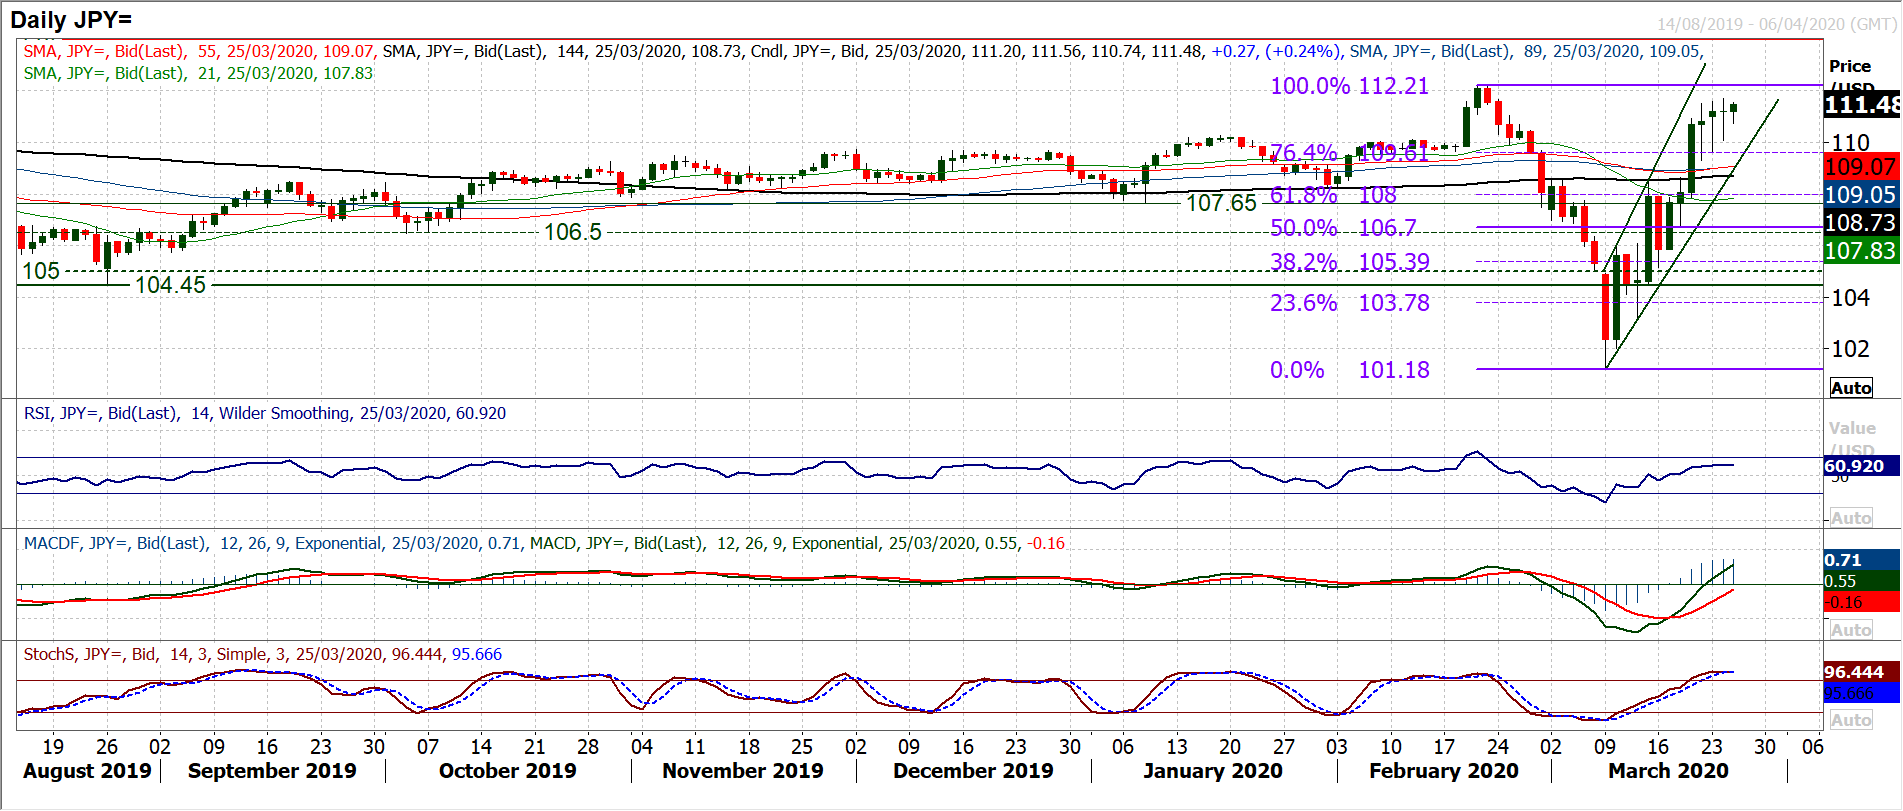
The dollar bulls have been beginning to fumble their way forward in recent sessions. The last three sessions have seen only small gains but coming with long lower shadows on the candlesticks. Yesterday’s close of just +1 pip formed an almost perfect “doji” candlestick (very rare in forex) and is a candle that denoted uncertainty with the prevailing trend. The run of recent candles suggests the presence of sellers who are threatening on a daily basis, but cannot quite pull together with conviction. We discussed the prospect that the bull run was losing impetus yesterday and this is still the case as Stochastics begin to top out. This is a function of the intraday selling that impacts on Stochastics through the formula of its calculation but also is a reflection of the waning upside momentum. The hourly chart shows resistance around 111.60 which is growing under the key January high of 112.20. Momentum indicators are increasingly moving into an oscillating configuration of range formation (albeit with a slight positive bias still), losing the previous trending momentum of a few days ago. This raises the prospect of profit-taking. The support at 109.65 is an initial gauge, whilst closing below the 76.4% Fib at 109.60 would add corrective momentum. A small top completes below 109.30.
Gold
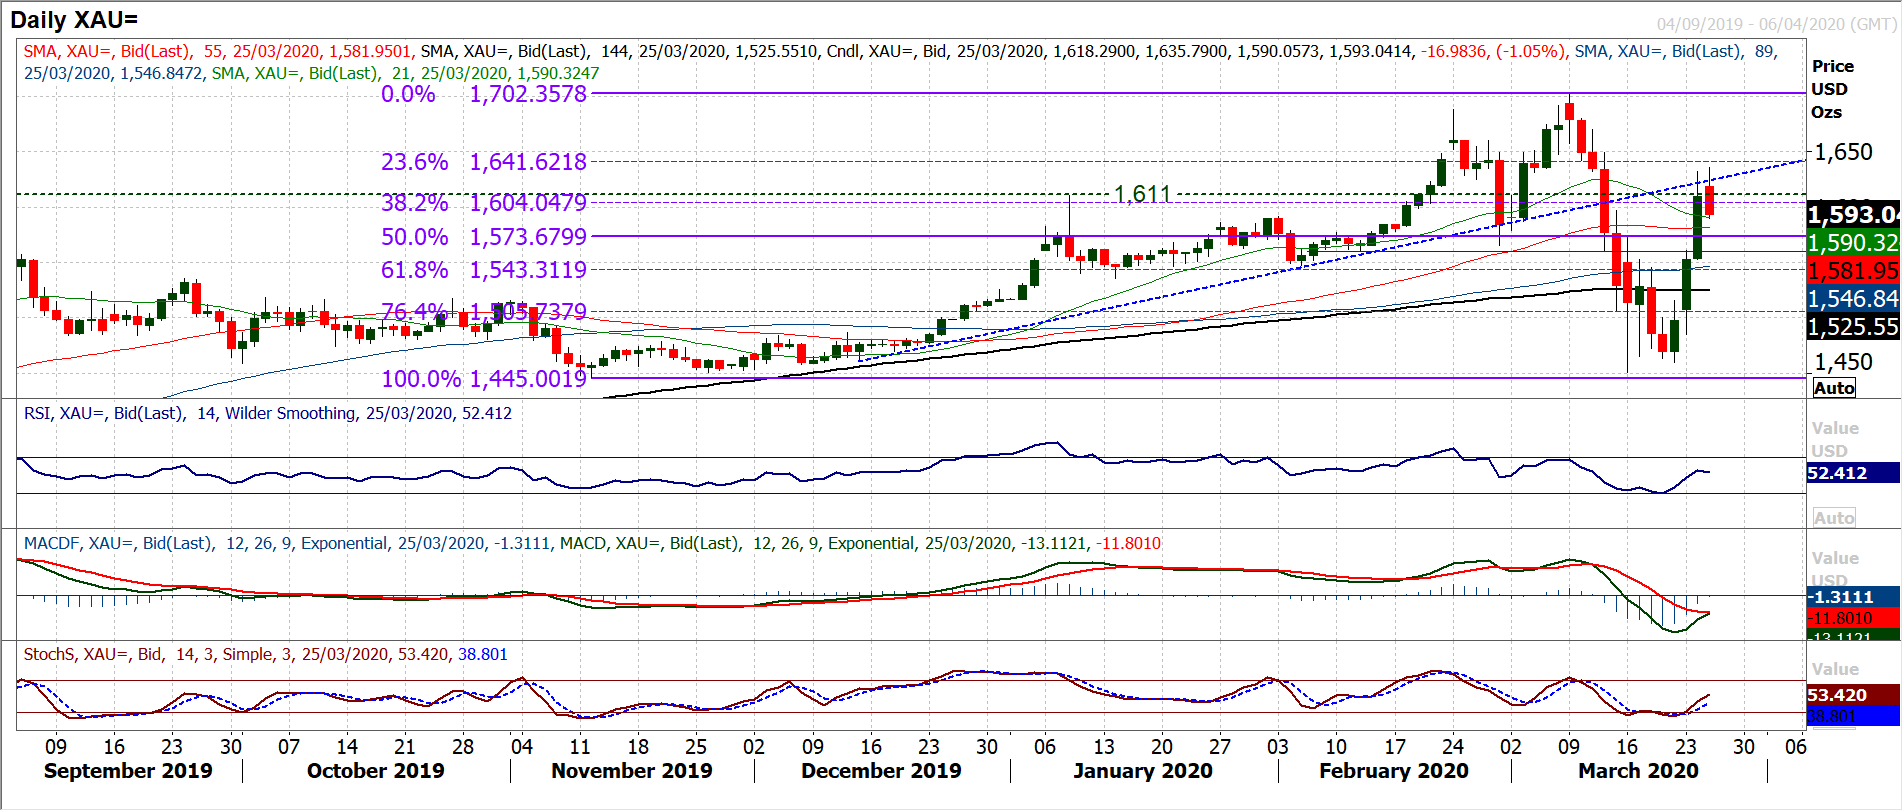
Gold has been seeing some wild movements in recent days as a sharp three day rally added over 10% back on to the price (having previously fallen almost -15% during the $1702 to $1450 sell-off). However volatility is still clearly very high and this does not necessarily mean that gold will be traveling entirely in one direction. As we come into the European session, gold is beginning to slip slightly once more. This could simply be an account of near term profit-taking (and effectively moderating some of the exuberance of the recent rebound). It could generate another corrective near term move though. The hourly chart shows a rolling over from $1635 overnight. This is unwinding overbought hourly momentum. If the RSI were to pull below 40 and hourly MACD back below neutral it would indicate that the near term bull move has played out and at least a more ranging outlook could be formed. A move back under $1585 (intraday low from yesterday) would add to the likelihood of a pullback towards the pivot area (of old highs and lows in the past couple of weeks) between $1553/$1560.
WTI Oil
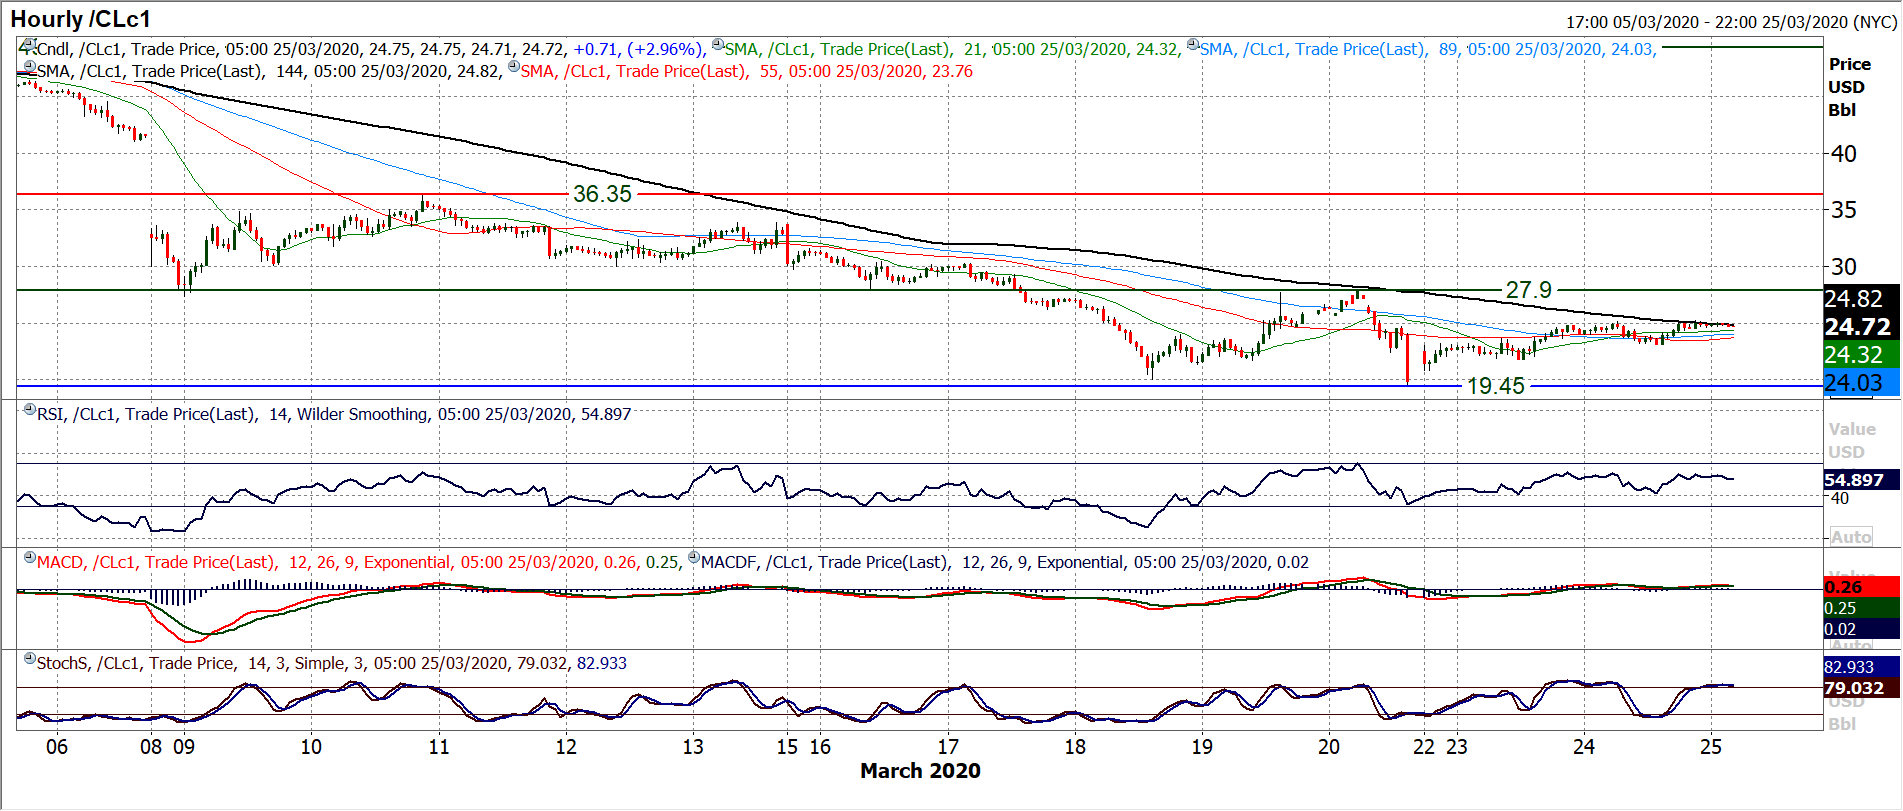
With the prospect of a more positive broader market backdrop, we see oil beginning to find support. The key low of $19.45 from last Friday has been the low of what has become a consolidation and what could turn into a base pattern recovery. It is interesting to see RSI momentum now beginning to tick back above 30, which is a near three week high. MACD lines are also threatening now to bottom out. It is still very early days in this move (if it is a recovery) with candles still relatively tentative. The Average True Range of $5.25 has not been hit in the past two sessions. However, at least there has now been two positive closes in a row, whilst oil is also solidly higher again coming into the European session today. There is so much upside potential for oil to go if there is a recovery that does for. The depth of the prospective base pattern is a mammoth $8.50 and the bulls will be eyeing the key resistance at $27.90 now. This shows well on the hourly chart, with momentum indicators taking on an increasingly encouraging recovery configuration (hourly RSI holding above 40 in the past couple of sessions). The resistance to overcome (and hold above) today is at $25.15, and if the bulls can do this then the prospect of challenging $27.90 (still a remarkable +10% higher from where the price is currently) in the near term will grow.
Dow Jones Industrial Average
Have the bulls finally got a technical recovery set up that is backable? Throughout this massive sell-off across the past few weeks, there have been isolated positive sessions. However, there have been very few daily gaps higher and even fewer breaches of important resistance. Yesterday’s huge positive session (the biggest one day gain since 1933) saw the Dow gap higher at the open and trade strongly into the close to form a decisive bull candle. This candle also pushed through resistance at 20,530 which was Friday’s lower high. This could now be the early stages of a recovery trend. There is a gap still open at 19,121 and with the volatility still elevated, there is a real prospect of this gap still to be filled. However, today’s session could be key as to whether the market has left a key low at 18,213 and whether that is a “breakaway gap” that gets left unfilled. Momentum has ticked higher on RSI but needs a move above 45 to be a four week high. Stochastics and MACD are yet to significantly improve, so this is still very early days for a rally to be confirmed. Next resistance to overcome (the next lower high) is at 21,379. Two positive candles in a row would be a good indication that the bulls are fighting back.
