Market Overview
With COVID-19 spreading internationally, there has been a marked change in the outlook on financial markets in the past week. Traders are taking a view and that view is to sell risk. Last week, the concerns were around how Japan would be negatively impacted. Now, with comments from US health officials, noting “this could be bad”, the spread of the virus reaching the US in any significant way could be the next trigger signal to look out for. Already expectations of a Fed rate cut are being hauled forward and are now at a probability of around 65% for a cut in the meeting at the end of April. This helped to drive the US 10 year yield to record lows yesterday, below the previous low of 1.321% from July 2016. There is little reason for investors to not buy the safety of US Treasuries right now, so it is unlikely that yesterday’s low of 1.307% will be a turning point quite yet. The US dollar has slipped back amidst this move, however, taking a bigger picture view, it is difficult to see the US dollar not recovering amidst this preference for safe havens. Already this morning, we are seeing support returning. Wall Street equities are being smashed and the oil price is also under pressure. Intraday rallies on risk assets are seen as a chance to sell. Gold has seen some profit-taking in the past 48 hours, but already support is beginning to form again, and any weakness will likely prove short-lived.

Wall Street closed another session sharply in the red, with the S&P 500 -3.0% at 3128, whilst US futures are only +0.1% today (already giving up earlier gains). Asian markets have been sold off, albeit at a lesser extent, with the Nikkei -0.8% and Shanghai Composite -0.8%. European markets are taking account for the last US selling into the close last night, with FTSE futures -0.9% and DAX futures -1.0%. In forex, after a brief period of correction early this week, USD is beginning to regain its performance this morning, and outperforming the majors (aside from CHF which is holding ground). In commodities, safety is once more the name of the game, with gold bouncing back over +0.5% higher whilst oil is around half a percent lower as selling continues.
Once more today, it is a quiet European morning on the economic calendar, with only minor US data later in the session. US New Home Sales at 1500GMT are expected to improve to 710,000 in January (from 694,000 in December). The EIA crude oil inventories at 1530GMT are expected to show stocks building by 2.5m barrels (after a build of +0.4m last week).
There are also a couple of Fed speakers on the agenda, with Robert Kaplan (voter, centrist) at 1445GMT, whilst Neel Kashkari (voter, and significant dove) is at 1800GMT.

Chart of the Day – AUD/JPY
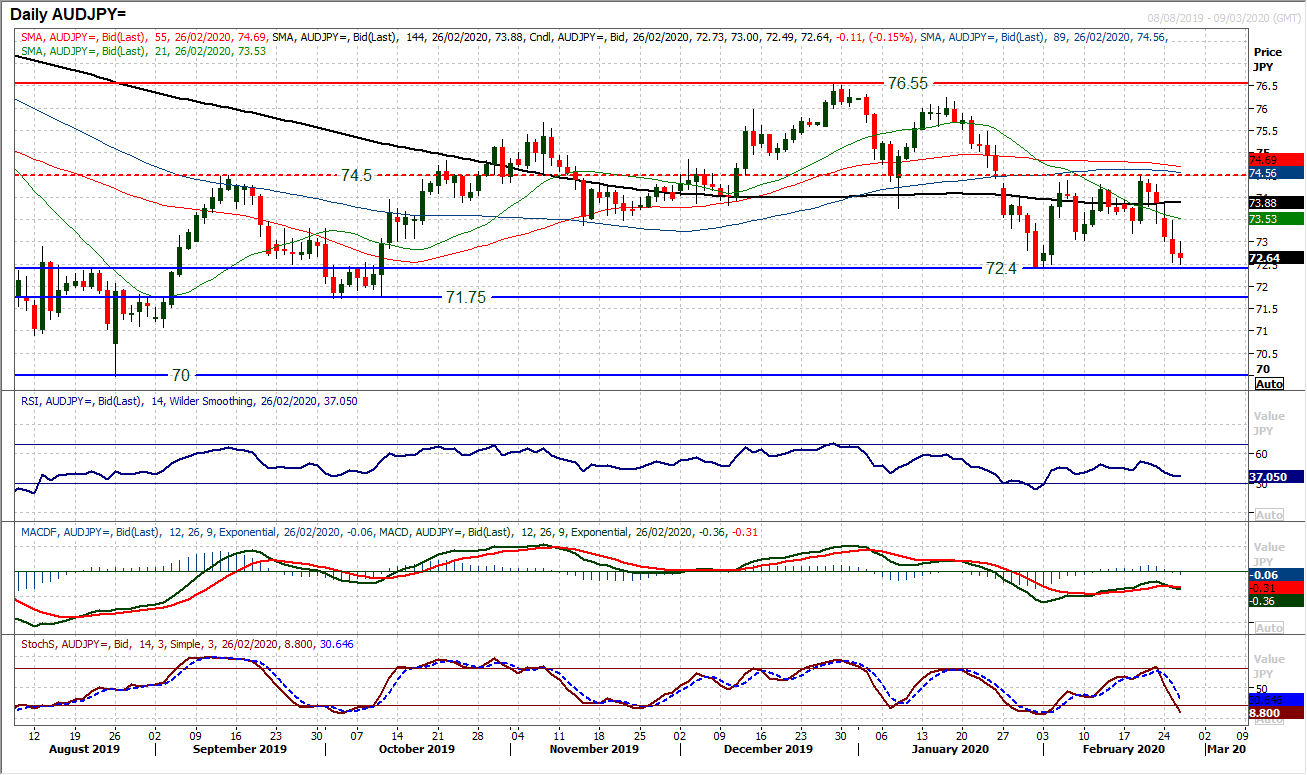
Selling pressure on risk assets has really taken off in recent days amidst the fears of the impact of COVID-19. A great indicator of this is the move lower on AUD/JPY, as the higher beta (higher risk) Aussie falls relative to the safe haven Japanese yen. The move is now testing the key medium term support at 72.40 which is the January low. Since mid-January (when the Coronavirus really became an issue on major markets) we have seen AUD/JPY under pressure. A failed rally has since bolstered key resistance of a pivot at 74.50 and four successive bear candles reflect the growing downside momentum. The concern is that intraday rallies in each session have been successively sold into with greater magnitude. Momentum is bearishly configured but also with further downside potential. The RSI is into the mid-30s, whilst MACD and Stochastics have only just bear crossed. The market is set up to sell intraday strength once more, with an initial resistance band 73.00/73.20. A closing breach of 72.40 opens the October low at 71.75 as the next test of support.
EUR/USD
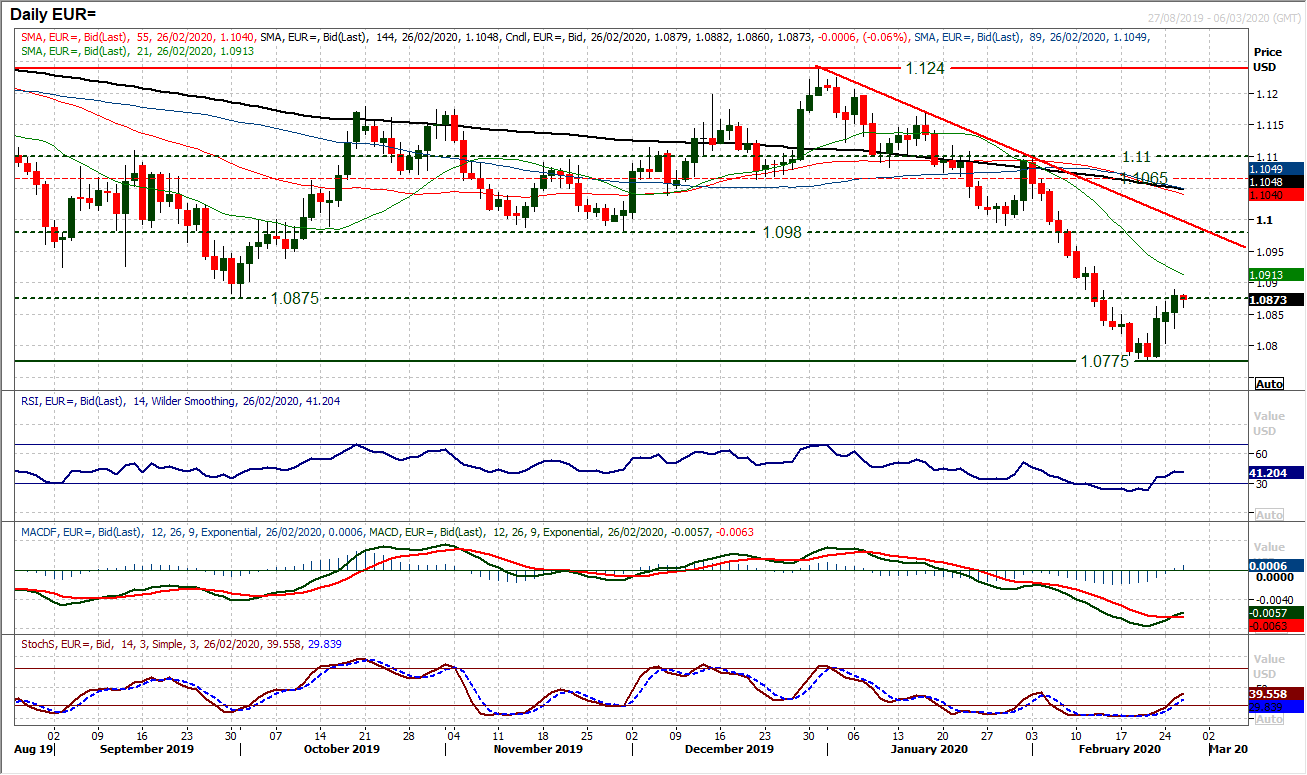
We have been seeing a prospective technical rally developing in recent sessions, as the euro has now formed three positive candles in a row on the daily chart. The question is whether real traction can be found in recovery, or whether this is simply a move that falters once more. Taking a step back, we see this as a rally within a bigger bear phase and a move to simply help renew downside potential. For now though, the market is running higher, and the bulls will be taking heart from the improvement in momentum indicators. With the RSI rising back above 40, bull crosses now on MACD and Stochastics, the near term rally is progressing. Trading decisively clear above the overhead supply and resistance in the band $1.0865 (near term base neckline) and $1.0875 (old key October low) opens a +90 pip further recovery and a $1.0950 target area. The next real resistance is not until $1.0980 now, with the 8 week downtrend resistance around $1.1000. With higher lows and higher highs in each of the past thee sessions, the near term rebound is doing well. But it is an unwinding move and is unlikely to last too long. Yesterday’s high of $1.0890 is initial resistance, with support at $1.0830.
GBP/USD
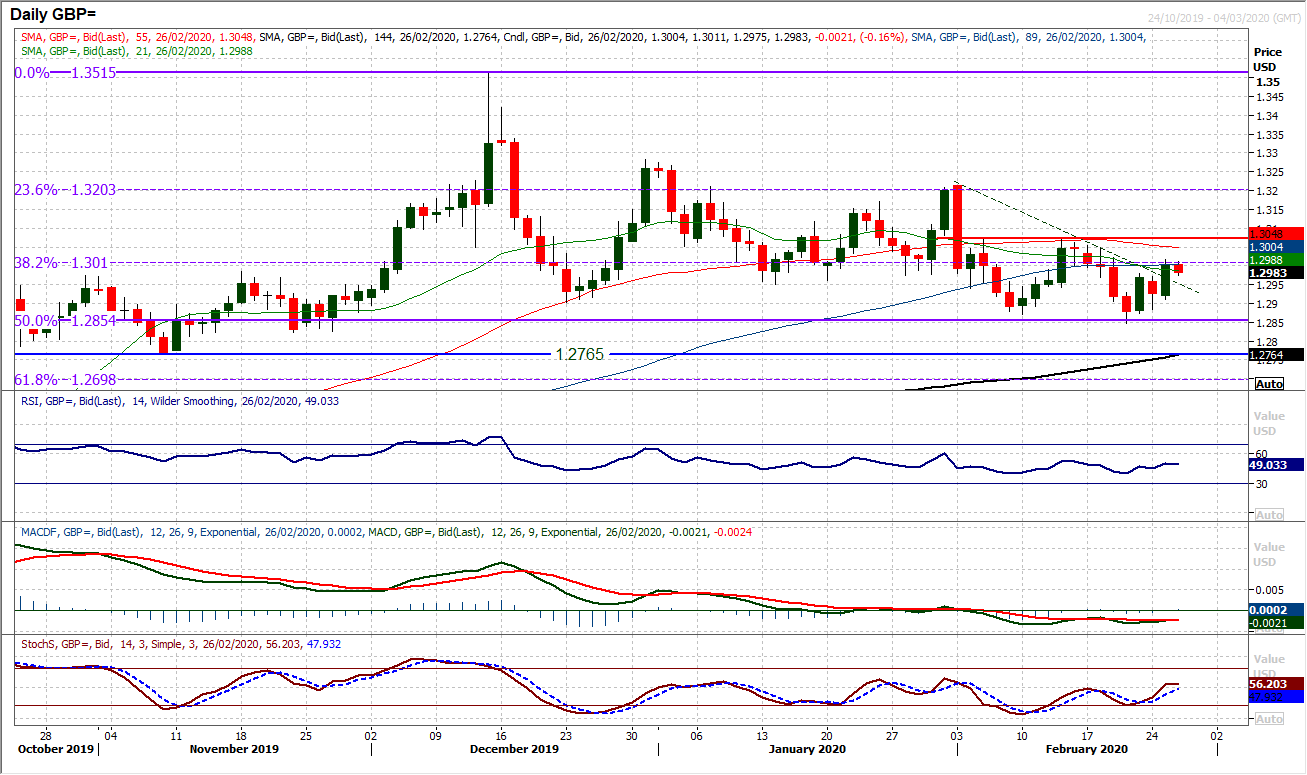
The outlook on Cable remains as choppy as ever. A recent three week trend lower has now been broken as the market has rebounded from the $1.2840 low last week. However, this latest rebound that has once again scuppered any sense of traction, is struggling to build on its own recovery momentum. The rebound is now encountering a confluence of barriers with a batch of faltering moving averages, psychological resistance at $1.3000 and the 38.2% Fibonacci retracement (of $1.2195/$1.3515) at $1.3010. It is also notable that given the jagged configuration of the rally (again the market is stuttering lower today), there is little real traction through momentum indicators either. The MACD lines are flat, whilst RSI and Stochastics are again around their neutral points where the mid-February rally faltered. The important resistance to now watch is the lower high at $1.3070. Unless this barrier can be overcome, there will be a building run of lower highs. Initial resistance is at yesterday’s high of $1.3017. The hourly chart shows that moving clear below $1.2980 (an old near term pivot) would see the move deteriorate again. Below $1.2950 opens $1.2885.
USD/JPY
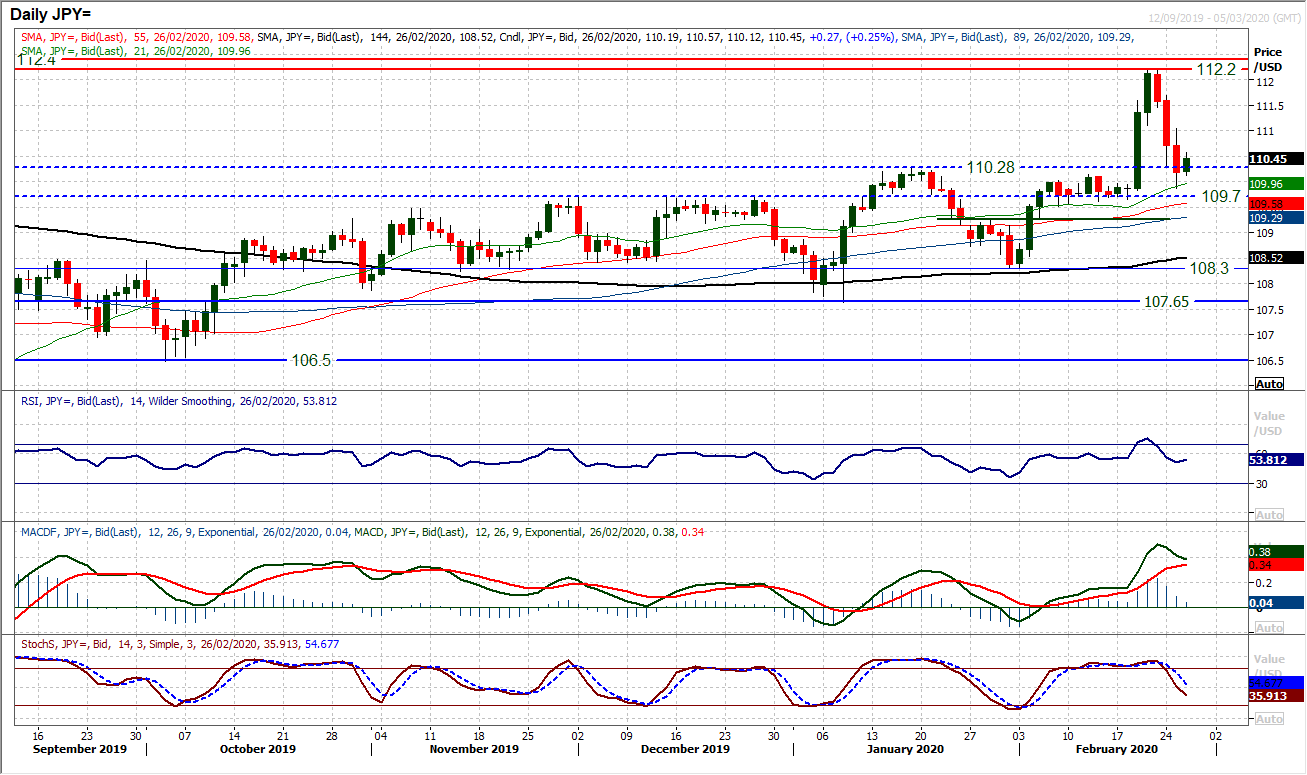
Dollar/Yen is a difficult market to call right now. The yen weakened sharply last week as traders took a dim view of Japan and prospective recession. However, the move which added over 200 pips to Dollar/Yen has been entirely retraced, as fears over the impact on the US economy from COVID-19 have come out. Essentially though, both USD and JPY remain safe haven currencies in this time of elevated fear. As such the pair will likely remain choppy. Technically, the outlook for USD/JPY is positive whilst the support at 109.50 remains intact. After three big bear candles, a basis of support is coming in today and the pair has ticked higher above 110.30 again (the old key breakout). Despite this though, the hourly chart shows a downtrend formation of the past few sessions, where lower highs are forming. Resistance is around 111.00 but the hourly RSI needs to be watched as there is a slight positive divergence and a decisive move towards 60 would hint at renewed dollar positive bias forming once more. Initial support at 109.85.
Gold
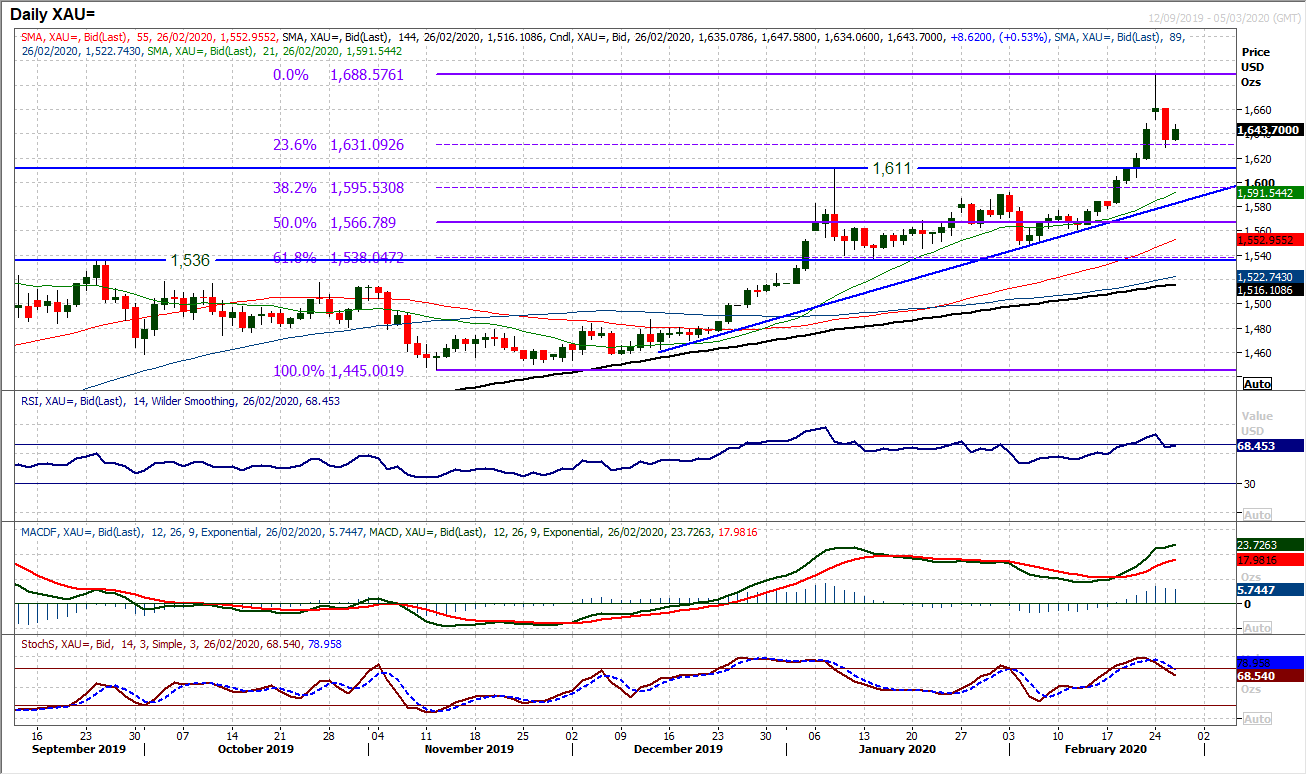
Given the elevated levels of fear running through broad financial markets right now, the appetite to buy gold will likely remain solid. Yesterday’s decisive negative candle saw the market closing -$25 lower as a bout of profit-taking took hold. However, we see this as a near term move that has just tempered some of the exuberance, rather than changing the outlook. We see it as similar to the January bull run which culminated in a -$75 move back from the high, before the bulls took control again. Blowing the froth off the top can be a good thing for a bull run. Gold unwound -$60 to yesterday’s low, but already the signs are that the bulls are returning again. The move has unwound to 23.6% Fibonacci retracement (of $1445/$1688) at $1631 around which support is forming. Although momentum has lost some of its zing, there is still a sense that near term moves lower will find willing buyers again. The market may have closed a gap at $1649 (theoretically negative) we are not anticipating a deep correction. This may mark the early stages of a more considered phase of consolidation for gold, but weakness remains a chance to buy. The hourly chart shows support at $1628 above the $1611 key breakout. Above $1660 would re-open the upside.
WTI Oil
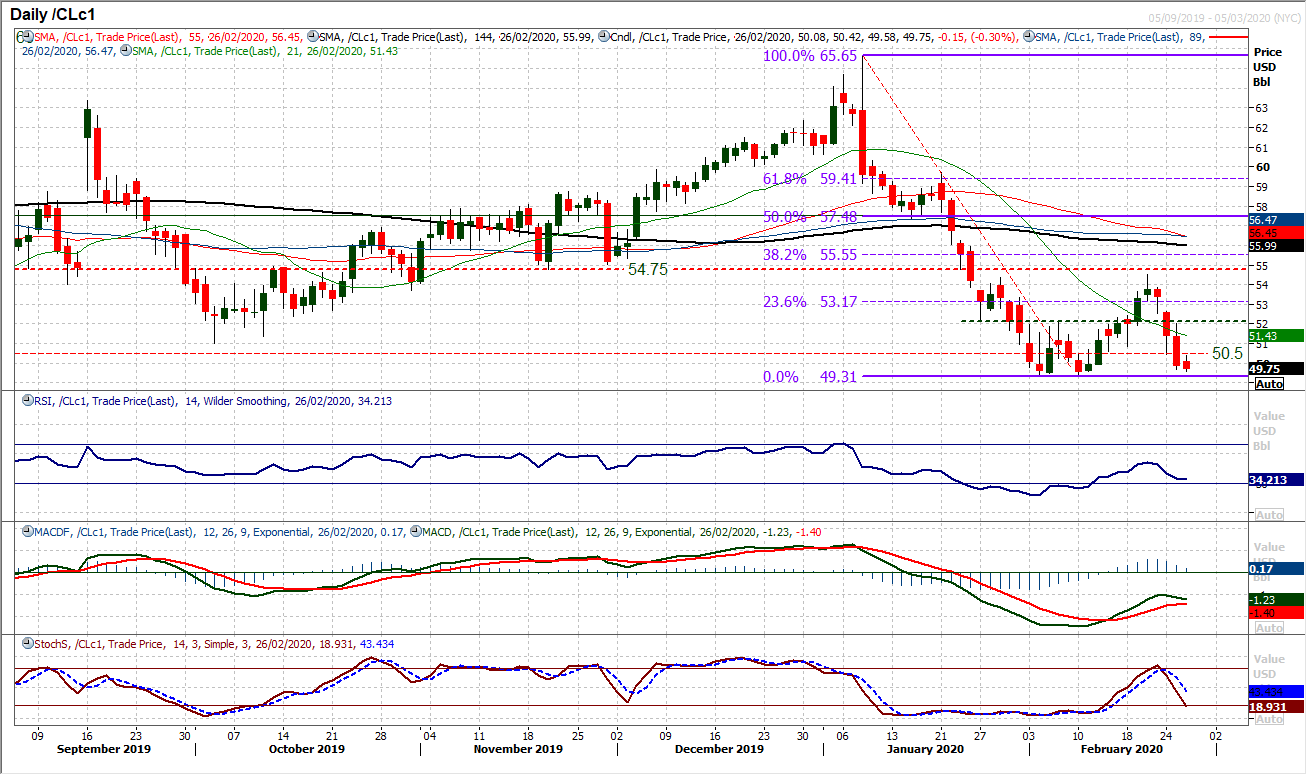
The selling pressure continues to build on oil as WTI has dropped back below $50 again. Losing support at $50.50 suggests that the prospect of a recovery being sustainable is still low. The key early February lows at $49.30 are now under direct threat. If these are breached there is little to prevent a move back to the crucial December 2018 low at $42.35. Momentum indicators are suffering again, as RSI and Stochastics deteriorate with downside potential, and MACD lines threaten to bear cross again. Already we see an intraday rebound faltering around the old support at $50.50 and this adds to the building negative pressure now. The hourly chart shows how the resistance is also increasingly strong in the $52.00 area of yesterday’s lower high. Hourly chart momentum suggests intraday rebounds are a chance to sell.
Dow Jones Industrial Average
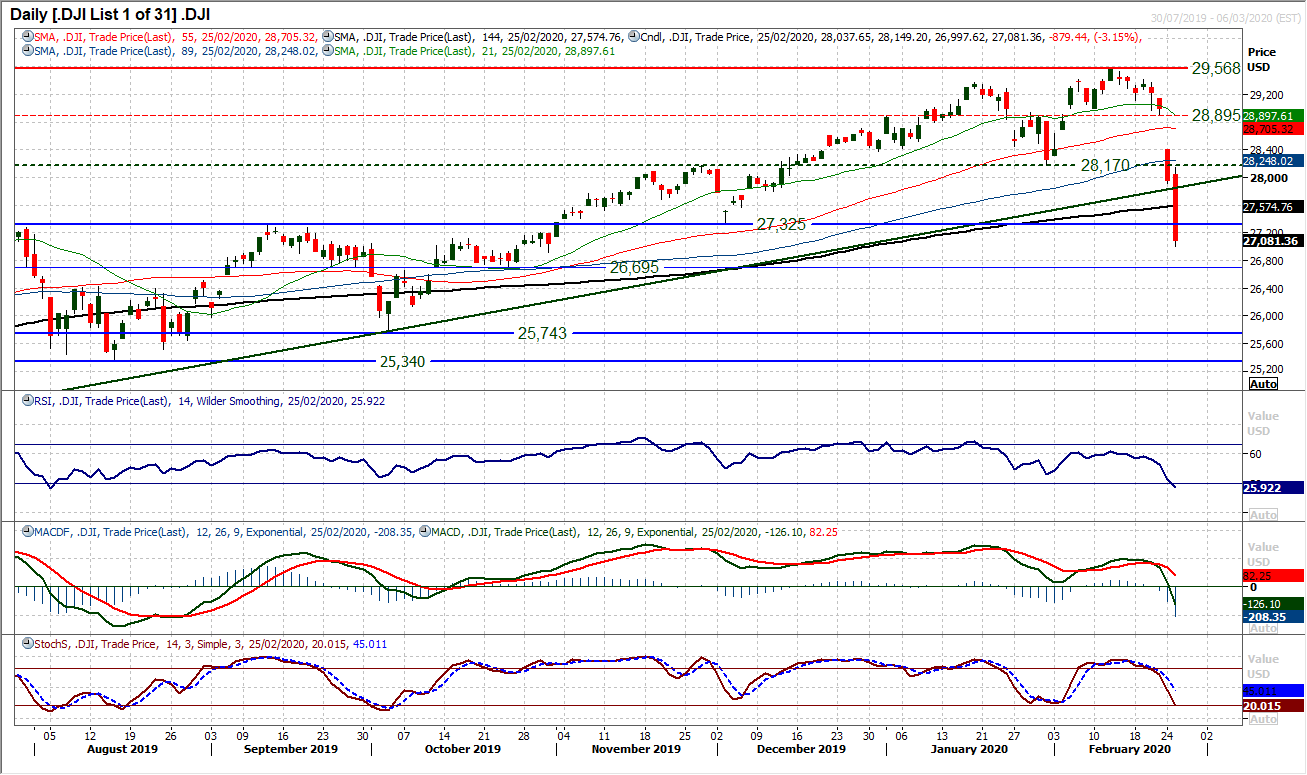
Another huge negative session on Wall Street has seen the Dow plunge over -800 ticks and over -3% lower on the day. Key support levels are being smashed as traders seemingly panic sell on the prospects of the contagion of COVID-19. The Dow has now broken through key supports of old higher lows in each of the past two sessions. The January low of 28,170 was breached on Monday and yesterday the market broke the December higher low at 27,325. The market has now fallen almost -2500 ticks (over -8%) in the 8 sessions since the all-time high of 29,568. The outlook subsequently looks significantly different now. Old support is now new resistance at 27,325 and is the first level to watch on any technical intraday rebound today. Momentum behind the sell-off is huge right now and looking at MACD and Stochastics there is still downside potential, even if RSI is quickly down at 25. Panicked traders are seemingly taking it as a case of sell now, and ask questions later. The next support is at 26,695.
