Market Overview
Sentiment is turning sour once more as the spread of the Coronavirus increasingly impacts across the US. There has been a battle of conflicting forces on markets this week. Traders initially backing the easing and stimulus efforts are being pushed back amid the fear of the unknown impact of Coronavirus on both economic supply and demand. Bond markets are convinced that the Federal Reserve is not done in its emergency rate cuts. Fed funds futures are pricing for another three of perhaps even four more rate cuts, before the end of this year! The dollar is a big casualty in this. One of the big attractions of the dollar in recent years has been the yield differential. However, this is being priced out and the dollar is being smashed. Even the prospect of today’s Non-farm Payrolls report is doing little to hold up the selling pressure. Forex performance still with a dichotomy between who can cut rates the most, impacting on expectations for rate differentials. Yen, Swiss franc and the euro all strong. The longer that bond yields fall, the worse it will get for the US dollar. Gold is a big beneficiary in this too, whilst equities are coming under renewed selling pressure. It is just a week since the big sell-off on equities was coupled with a margin call driven sell-off on gold. This will be fresh in the mind of gold traders as the yellow metal yesterday posted its highest daily closing price since January 2013.
Wall Street fell hard again amidst renewed selling pressure. The S&P 500 fell by -3.4% at 3024, with US futures another -0.7% back today. This has hit across Asian markets, with the Nikkei -2.7% and Shanghai Composite -1.2%. In forex, there is a continuation of the USD negative outlook this morning, with JPY and NZD being the standout performers. One notable exception however is EUR which is stuttering around resistance against the dollar. In commodities, gold is consolidating its big advance from yesterday, whilst oil continues to slide back as traders wait for the response from Russia and Kazakhstan on production cuts in the OPEC+ meeting.
The payrolls report dominates the economic calendar today. The US Employment Situation report is at 1330GMT and is expected to show headline Non-farm Payrolls increased by +175,000 in February, which is down from the +225,000 of January. Average Hourly Earnings are expected to have increase by +0.3% on the month meaning the year on year wage growth moderates slightly to +3.0% (+3.1% in January), whilst US Unemployment is expected to remain at 3.6% (3.6% in January).
There is just one central bank speaker pencilled in for today. The FOMC’s John Williams (voter, centrist) is speaking at 1900GMT.
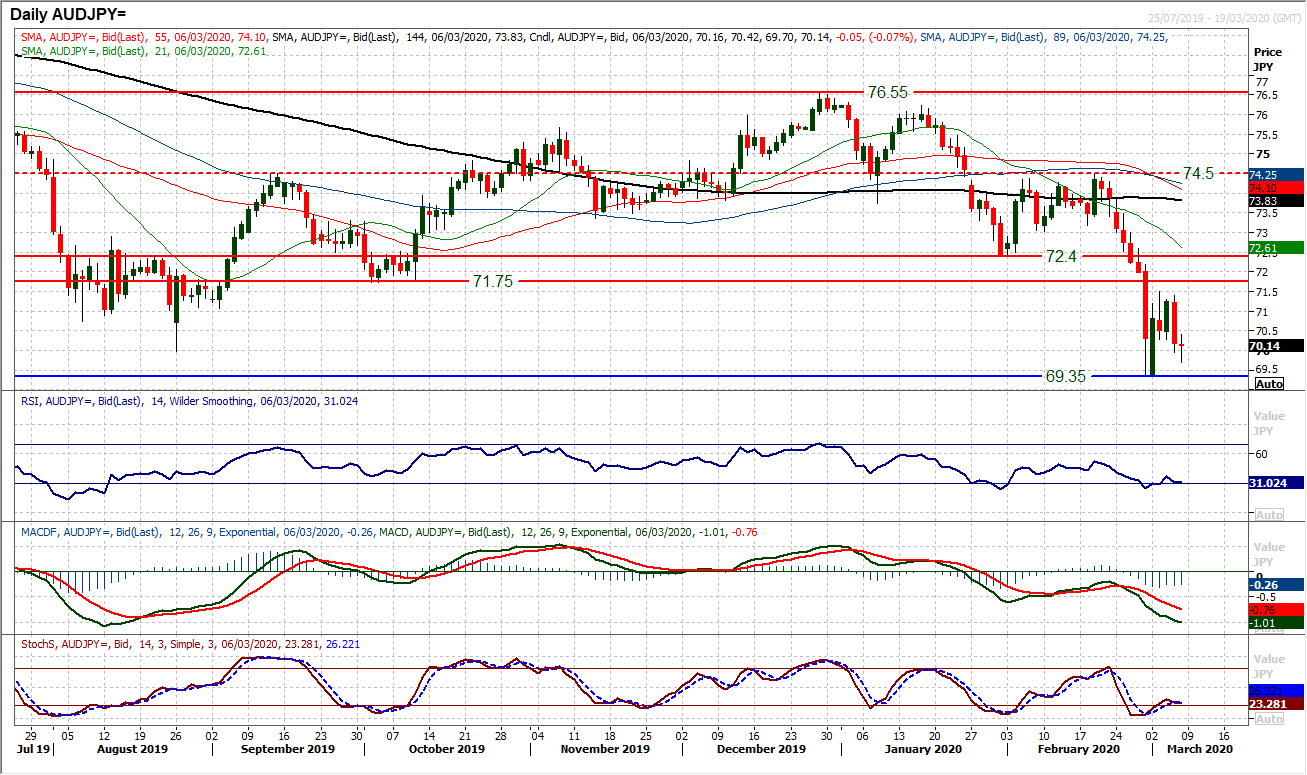
Chart of the Day – AUD/JPY
For some time, Aussie/Yen has been a good gauge for risk appetite. With the spread of coronavirus this is especially the case now. There has been more of a mixed outlook for risk in recent days (following the series of coordinated rate cuts) and this has resulted in mixed moves on AUD/JPY. The question is whether a bottom has been seen at 69.33. Candles have been decidedly choppy and fluctuating in the past week, however, a decisive bear candle yesterday is being followed by further losses this morning and a bear bias is taking hold. Momentum has been trying to improve early this week, but is deteriorating once more as the Stochastics roll over again. A false dawn it would seem, with the RSI back and struggling around 30 again. After the strength of the negative candle yesterday, today’s reaction will be important. Another negative move could see a quick reverse back to the lows at 69.33 again. Breaking initial support at 70.27 this morning is a concern and this will increase if seen on a closing basis. The bulls need to pull back above 71.50 before there can be any real conviction that a recovery is taking hold. There is initial resistance at 70.25/70.40 under the overhead supply between 71.75/72.40.
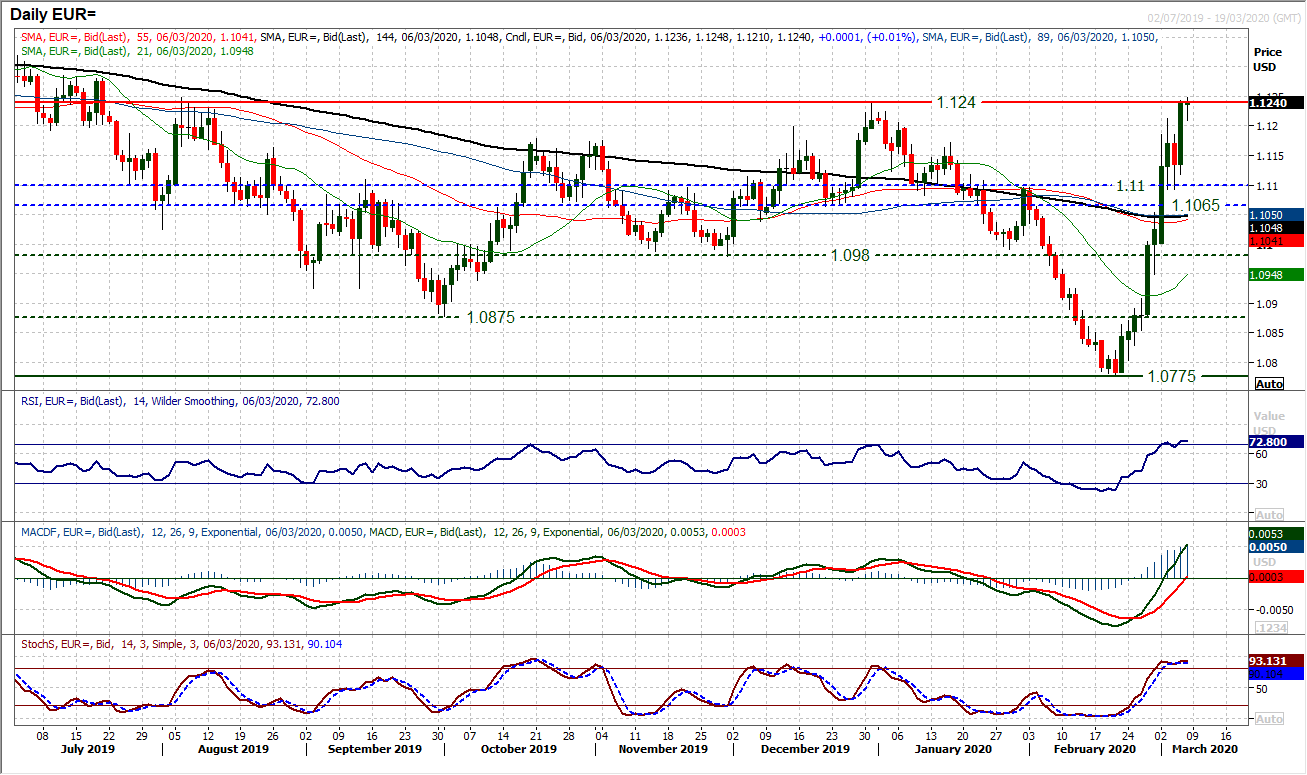
EUR/USD
There have been early signs of exhaustion in the rally, but the EUR/USD bulls keep on powering through for now. It is difficult to see the dollar regaining much ground whilst Treasury yields continue to plunge new depths. EUR/USD is back to a key barrier, with the resistance around $1.1240 being tested. An incredible move considering just two weeks ago the market was deeply bearishly configured around the multi-year low of $1.0775. A tick back from an early session high of $1.1248 has been seen today with the RSI again over 70. As we found out in mid-February, the traditional limits to the RSI on EUR/USD (between 30 and 70) are being stretched and should not necessarily be seen as limits at all. Subsequently, a closing breakout above $1.1240 today could open the next phase of buying towards $1.1410. The hourly chart shows initial support at $1.1185/$1.1210 (recent old highs), which will gauge the strength today. Hourly MACD turning over give a sense that the market is paying attention to $1.1240, so care does need to be taken with reversal signals. However, until $1.1095 is broken there would not be any real confirmed corrective signal.
GBP/USD
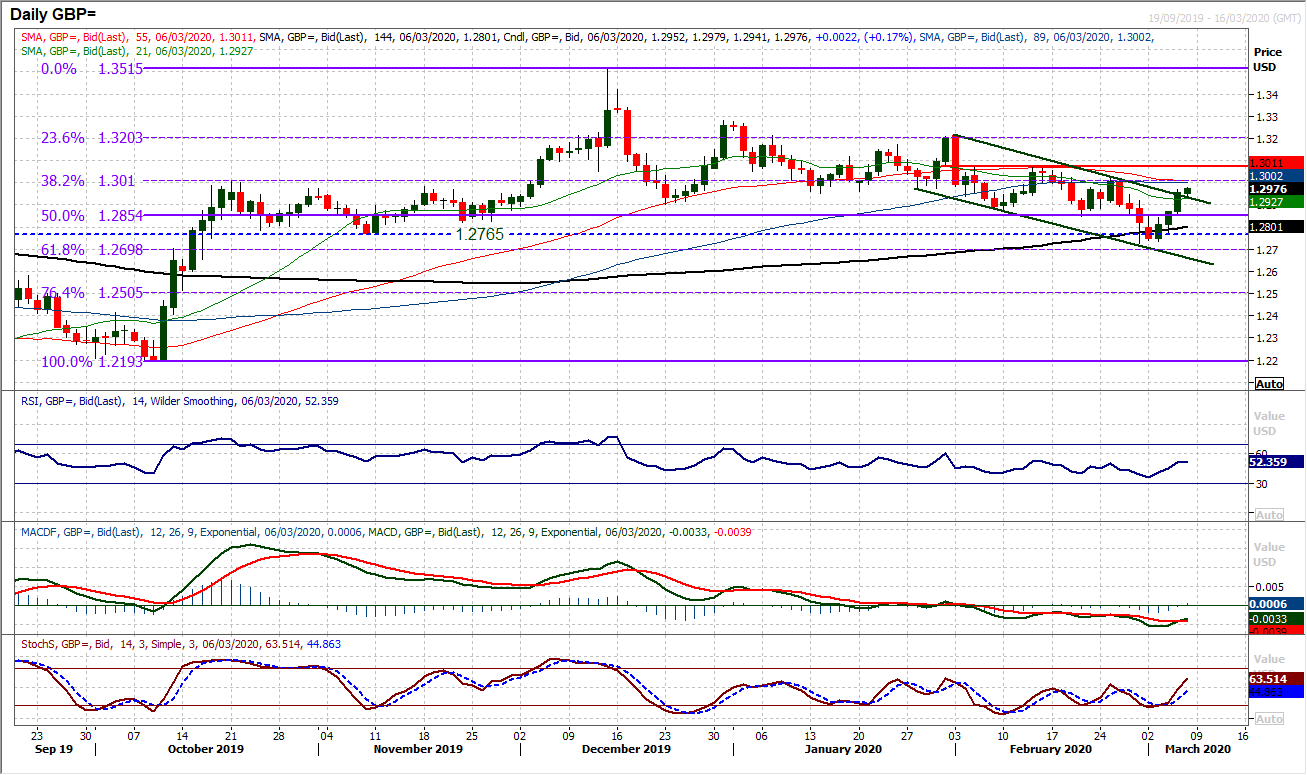
The Cable recovery formed a third successive positive candle yesterday and is now edging above the top of a recently formed four week mini downtrend channel. Given how Cable has been forming lower highs and lower lows in recent weeks, this rally needs to be treated with caution. Momentum indicators remain correctively configured and are back around levels (on RSI and Stochastics) where selling opportunities arise. The changer to this outlook of selling into strength would be a move above $1.3015 (the late Feb rebound high), especially on a closing basis. This would effectively re-establish Cable as a medium term range play and abort the run of lower highs. Support is around the $1.2850 recent pivot, which is also the 50% Fibonacci retracement (of the $1.2193/$1.3515) level at $1.2855. Yesterday’s low at $1.2860 reflects the increasing importance of this pivot.
USD/JPY
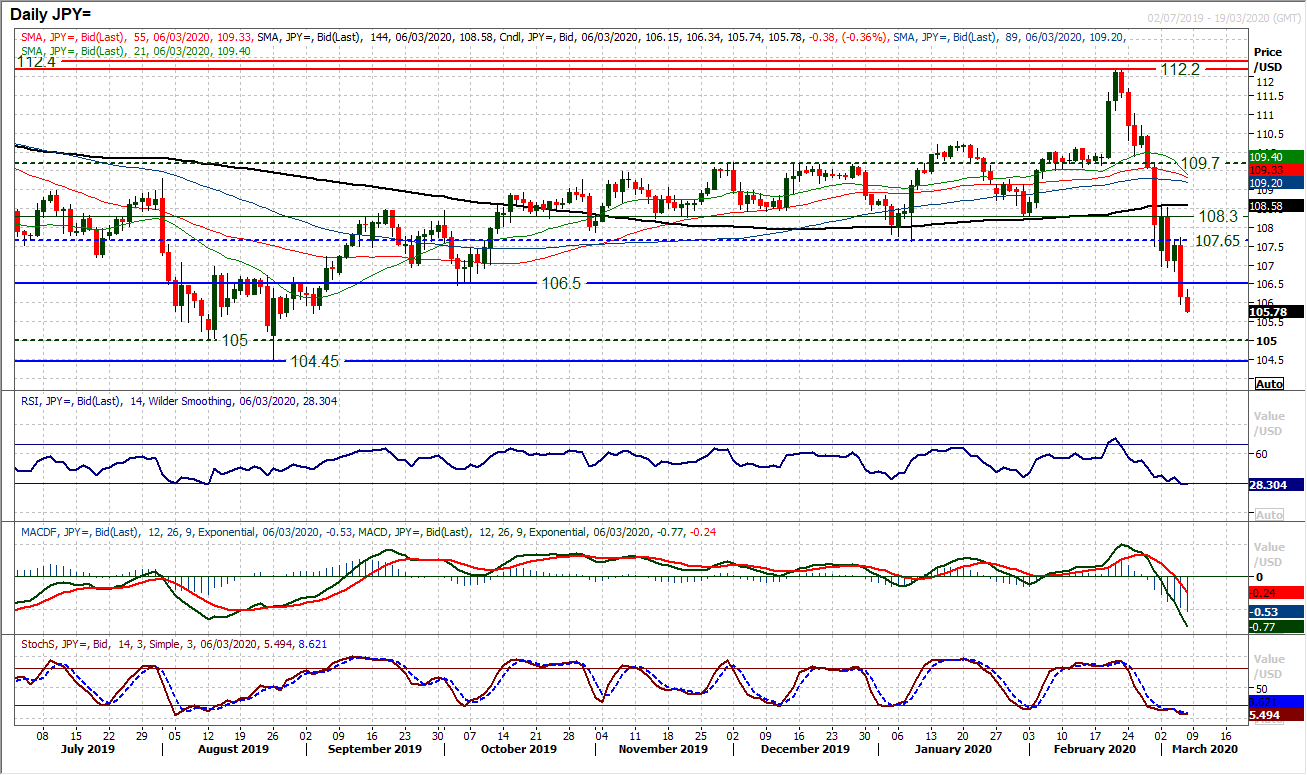
The bulls had the prospect of recovery once more swept away from under them. Another decisive negative candle has seen the market close meaningfully below the support at 106.50 in a move which effectively now opens the massively important long term support band 104.45/105.00. Even this morning, where there is a degree of dollar consolidation across majors, we see the yen strength continuing. The safe haven attraction of the yen remains a key feature of market moves. The negative momentum on Dollar/Yen is ever strengthening now, with RSI under 30, whilst MACD and Stochastics fall ever deeper into bearish configuration. Near term rallies are a chance to sell. The hourly chart shows resistance 106.50/107.00 and any technical unwind into this band will struggle now. A retest of the August lows 105.00 and 104.45 is on. The first real lower high of any note is at 107.75 and needs to be broken for any realistic prospect of a recovery holding.
Gold
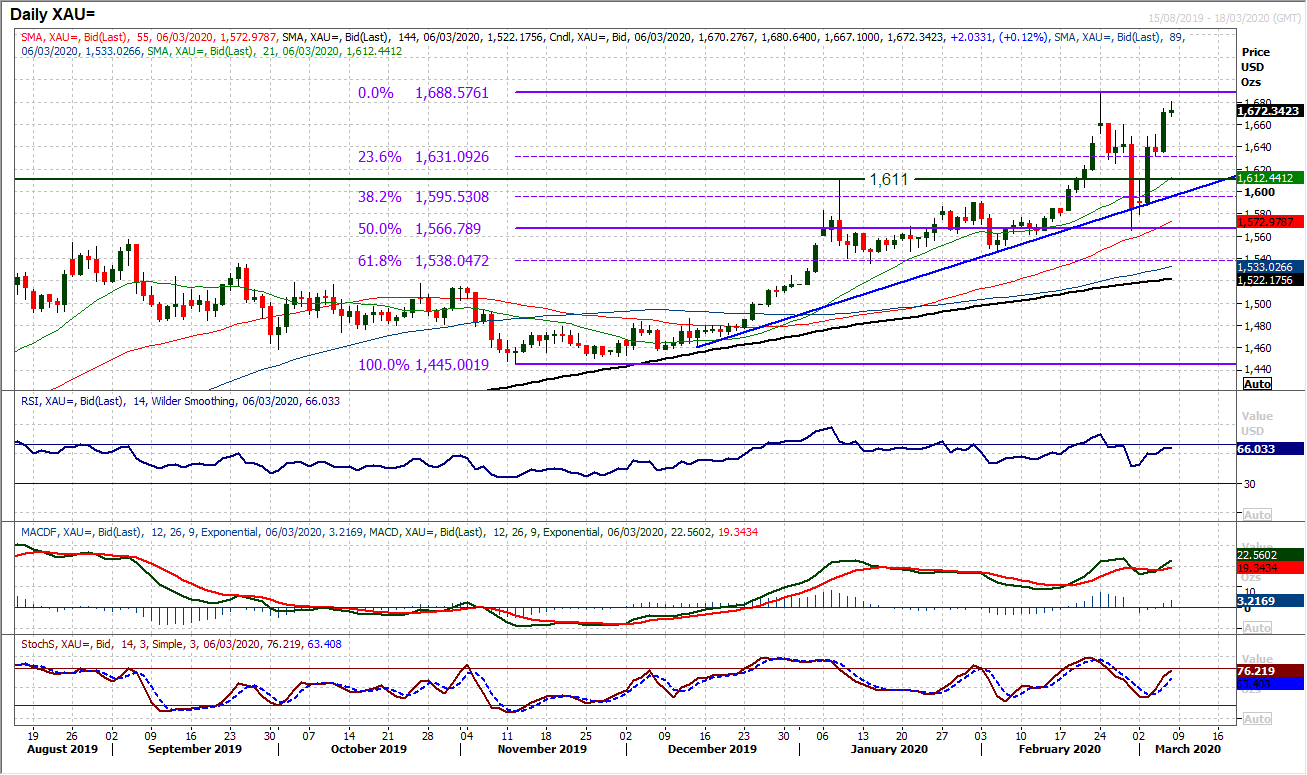
Gold has taken another step forward and the bulls are firmly in the driving seat now. Another strong and decisive positive candle has seen gold close at its highest level since January 2013. The intraday spike high of $1688 from a couple of weeks ago is the next level to be tested, but beyond that, the way is open once more into the $1700s. Momentum is increasingly strong once more, with the RSI into the mid-60s, whilst MACD and Stochastics lines both advance encouragingly. There is certainly upside potential in this move too. The market has been ticking higher initially this morning, but as we approach the European session, the gains have been slightly pared. We see weakness as a chance to buy, with the hourly chart shows initial support band $1651/$1660.
WTI Oil
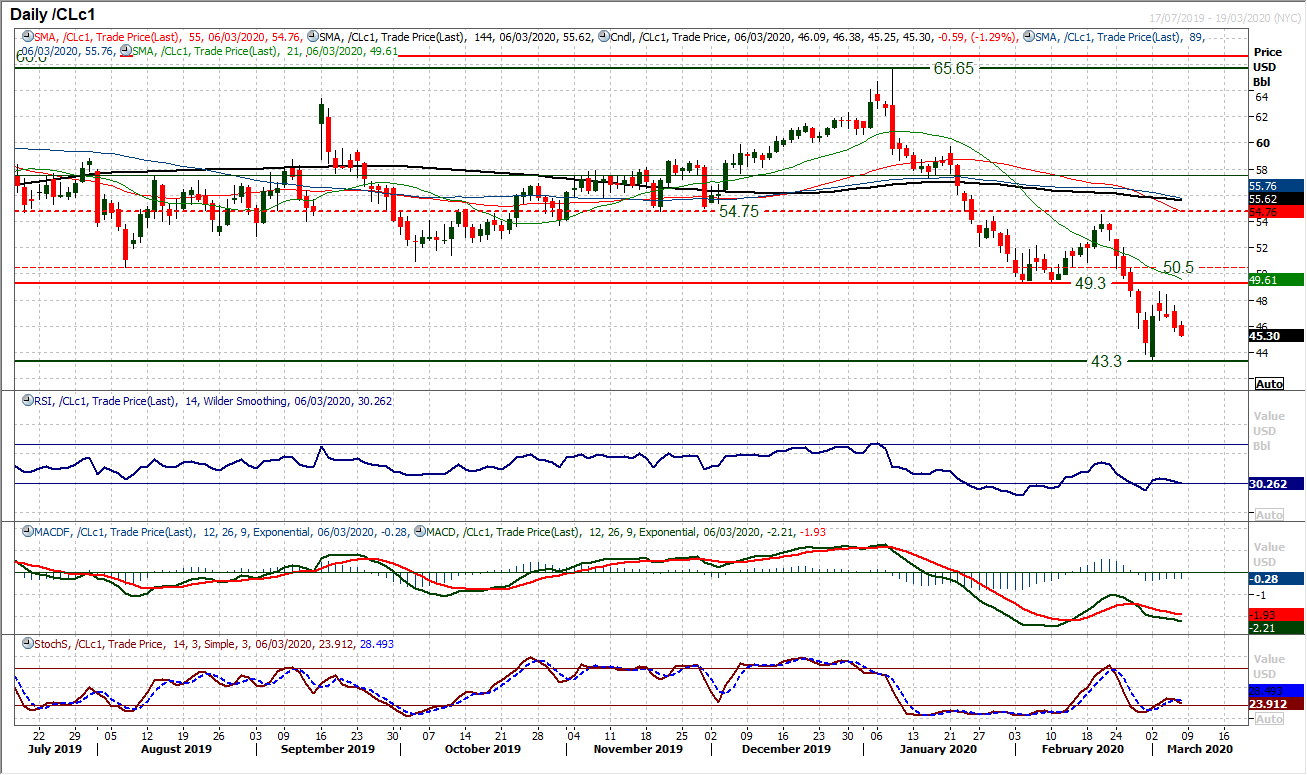
Oil had another day of negative drift, with a mild creep back lower yesterday. The past three sessions have seen the recovery momentum gradually leaking away as the market awaits the outcome of the OPEC+ discussions over production cuts. This move has continued this morning. Moving back under $46.00 (an old pivot from last week) would suggest the market is turning negative again. The hourly chart shows a higher low at $44.85 which if breached would open the $43.30 low once more. The RSI turning back below 30 would also be a negative signal. Resistance is building at lower levels on a daily basis now, under the $48.65 reaction high from earlier in the week, so yesterday’s high at $47.55 is resistance of note, along with the early high today at $46.40. Big resistance of overhead supply the bulls need to overcome for a recovery to really take hold comes in between $49.30/$50.50.
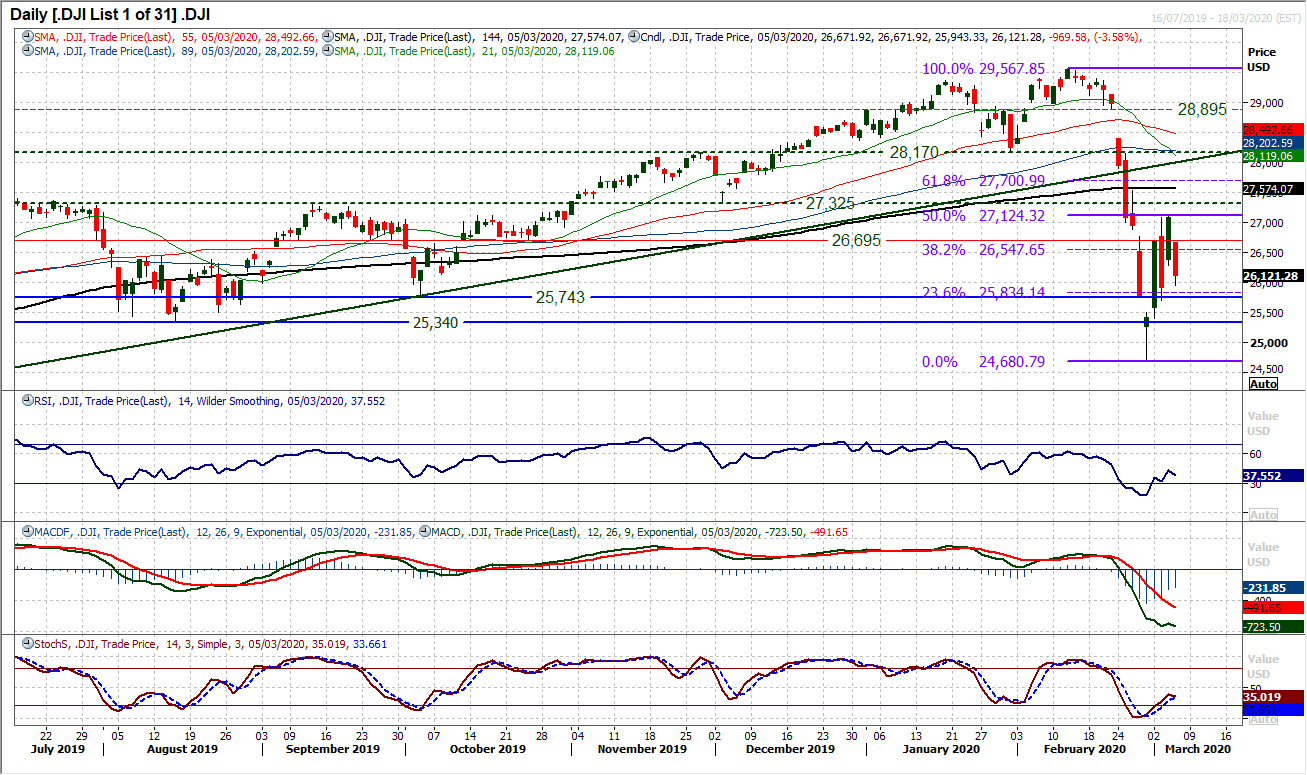
Dow Jones Industrial Average
It is becoming difficult to come up with different ways of saying “the incredible volatility continues” on Wall Street. Another huge range on the day, this time steeped in negativity. A huge swing lower, closing -3.6% lower and the bears are back in the driving seat. US futures point to losses continuing today, currently over -1% lower. Technicals do little for the outlook in this sentiment driven game. The pull higher of monetary and fiscal support, against the push lower of demand and supply fears arising from Coronavirus. Currently the latter is in the ascendency again, but who knows what he weekend might bring? The hourly chart shows 25,705 is a key higher low to watch in the recovery. A closing breach would effectively re-open the low around 24,875. Hourly momentum turning negative again does not bode well. Resistance at 27,100 is building now.
