Market Overview
The initial moves of a recovery in risk appetite have shown signs of stalling in the past 24 hours. Perhaps it is simply down to consolidation ahead of today’s Non-farm Payrolls data, but the momentum of the recovery from earlier this week has lost its impetus. This comes as consolidation begins to set in on bond yields (a slight renewed flattening of the US yield curve since Wednesday’s close) and safe have assets such as the yen and gold begin to find their feet again. The narrative on the Coronavirus has not changed. The virus continues to spread at an accelerating rate as do the number of deaths (now confirmed at 636). The PBoC is promising measures to help support the economy, and whilst analysts are slashing forecasts of growth in Q1, the expectation remains that by Q3 there will be renewed activity which will mitigate much of the impact. Looking across markets, there is still a bias to buy the dollar. A hybrid of safety and also a degree of economic resilience has pulled the Dollar Index to test four month highs. The China Trade Balance for January is still yet to be announced and is expected to be fairly negative +$38.6bn exp, (+$46.8bn in December) with Chinese exports -4.8% exp (+7.6% in December) and Chinese imports -6.0% exp (+16.3% in December). Once out, this data could drive sentiment this morning. However, as the session goes on attention will turn to the January US jobs report. After the ADP numbers came in hot on Wednesday, another indication that the start of 2020 has been decent. A positive surprise would add fuel to the dollar strength but also with no prospect of any change to Fed policy (in the next few meeting at least), aid a risk recovery too.

Wall Street closed mildly higher as the S&P 500 hit all-time highs +0.3% at a close of 3345. US futures are tentatively lower today -0.1% which has seen a mixed session in Asia (Nikkei -0.2% and Shanghai Composite +0.3%). In Europe, there is a slip back in early moves with the FTSE futures -0.2% and DAX futures also -0.2%. In forex, there is a mild bias back towards safe havens again today with JPY performing well and the commodities currencies (AUD and NZD) weaker. In commodities, there is consolidation on gold and oil.
The US labor market report dominates the economic calendar today. The US Employment Situation report is at 1330GMT and is expected to see the headline Non-farm Payrolls grow by 160,000 jobs in January (+145,000 in December). Average Hourly Earnings are expected to grow by +0.3% on the month which would improve the year on year wage growth to +3.0% (+2.9% in December). US Unemployment is expected to remain at 3.5% again (3.5% in December).
Chart of the Day – EUR/CHF
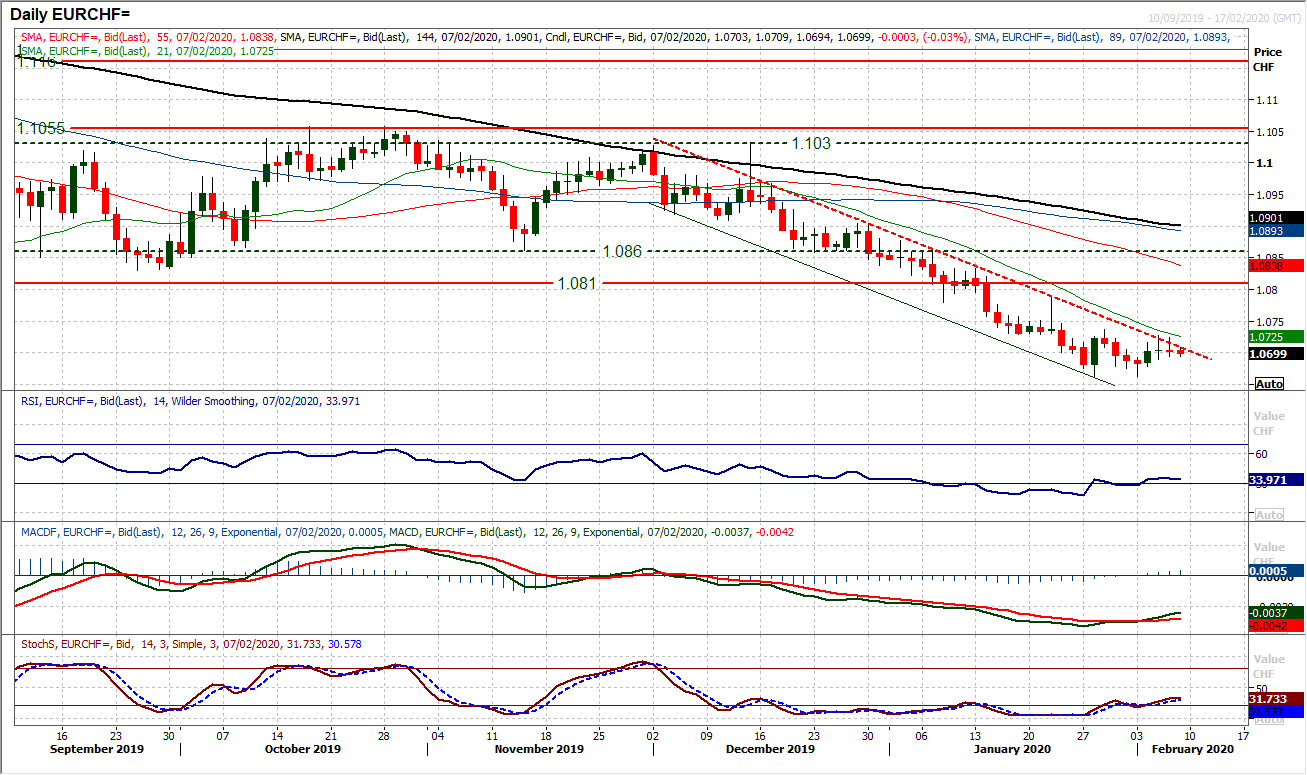
We have discussed the safe haven bias on forex majors of recent weeks during the Coronavirus. However, there are signs that the market is just beginning to switch out of safety. This is reflected in what looks to be a slowing of the negative momentum on Euro/Swiss. The cross has been in a tight downtrend channel for almost two months now, but in the past few sessions there have been marked positive divergences forming across momentum indicators. The RSI is now around five week highs (confirmation of a recovery would be the RSI closing above 40). Furthermore, the MACD lines have bull crossed and are now advancing. These all look to be lead indicators for a potential rally on EUR/CHF. There has been a degree of consolidation with some very neutral, small-bodied candles on Wednesday and Thursday, but the very well-defined downtrend is now being tested. Watch the 21 day moving average (today at 1.0725) which has been flanking the decline since mid-December and if broken would again be a positive signal. For a shift in the outlook there would need to be a move above initial resistance at 1.0735. This would be a small base pattern up from the lows at 1.0662 and imply a recovery back towards the key 1.0810 old floor. The hourly chart shows initial support at 1.0690.
EUR/USD
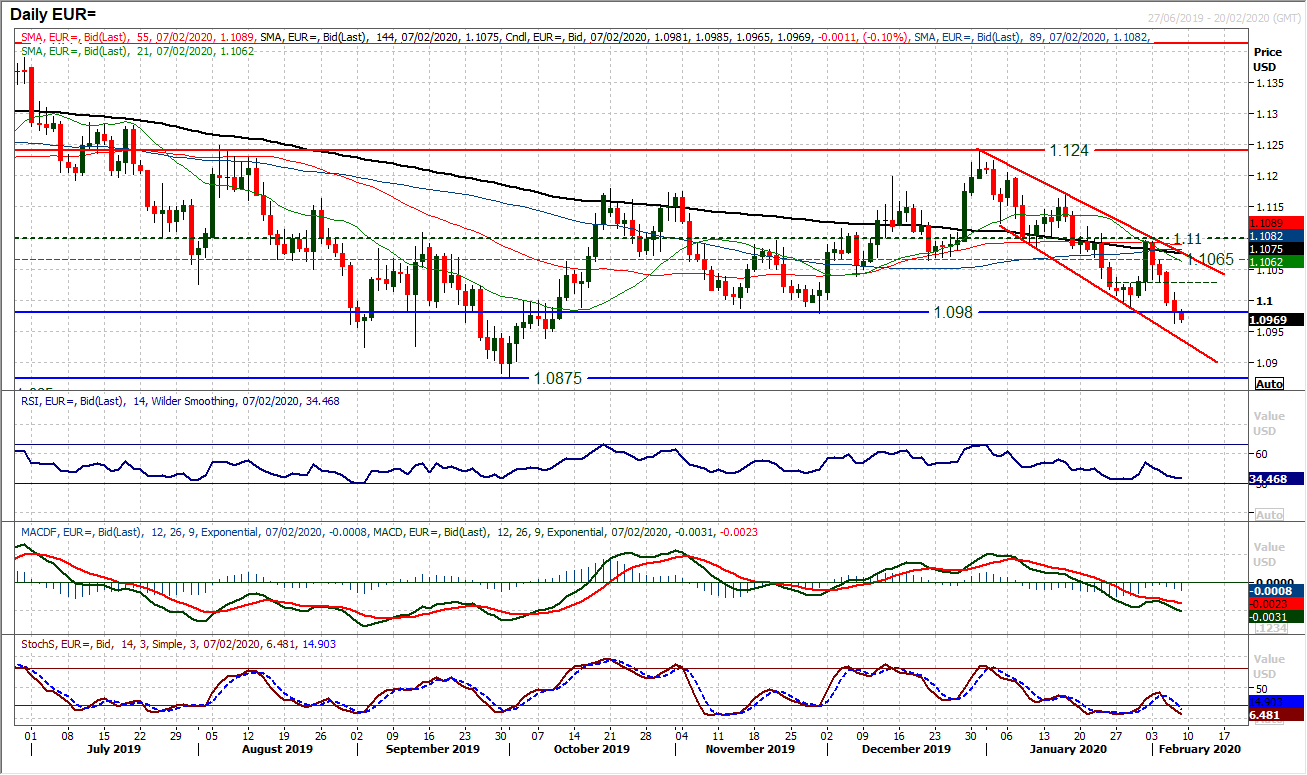
A succession of negative candles has dragged EUR/USD back to now breach the key support around $1.0980. Although yesterday’s close was bang on the support, the market is now consistently breaching the floor on an intraday basis. This move has taken the pair to a four month low and opens a test of the crucial support at $1.0875. The bottom of the downtrend comes in at $1.0940 today which is also a minor support level from October. The concern is that in bearish configuration, momentum indicators also have additional downside potential, with the RSI around 35 Stochastics still tracking lower and MACD lines also deteriorating. Non-farm Payrolls could be a source of early consolidation today, however, the price action this week would suggest that the market is looking for dollar strength to continue. As such, intraday gains on EUR/USD should be seen as a chance to sell. The hourly chart shows resistance $1.0990/$1.1015 for payrolls, whilst any failed rally under $1.1035 is another opportunity.
GBP/USD
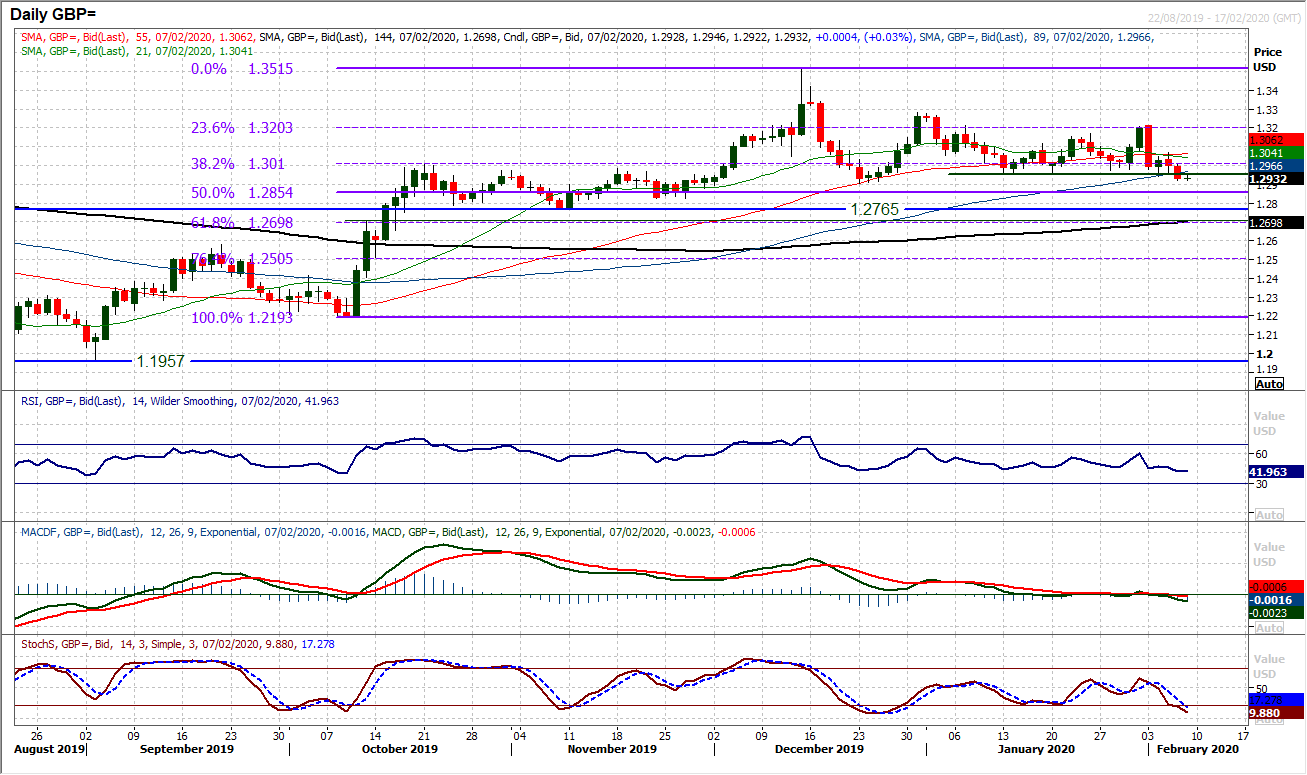
Cable stands on the brink of a key breakdown. For weeks, the support band around $1.2950 has been holding firm, protecting the $1.2900 December low. However, a solid negative candle yesterday was the first time this year that the market has dropped into the $1.2950/$1.3000 support band and not seen it as an opportunity. There is now a deterioration coming through on momentum indicators as the Stochastics confirm the breakdown and RSI drops to a four month low. The mild consolidation this morning comes ahead of payrolls data later, but a continued failure to not react back above $1.3000 would signal a shift in sentiment on Cable. The risk is now for a test of the $1.2900 December low. Taking a step back and on a multi-month basis this still looks to be a sideways ranging market, with the prospect that downward pressure could weigh back towards the November low at $1.2765 and still be in a medium term range. However, now there is a negative bias to the consolidation, something that has not been a feature previously. Initial resistance at $1.3000 and a lower high at $1.3070.
USD/JPY
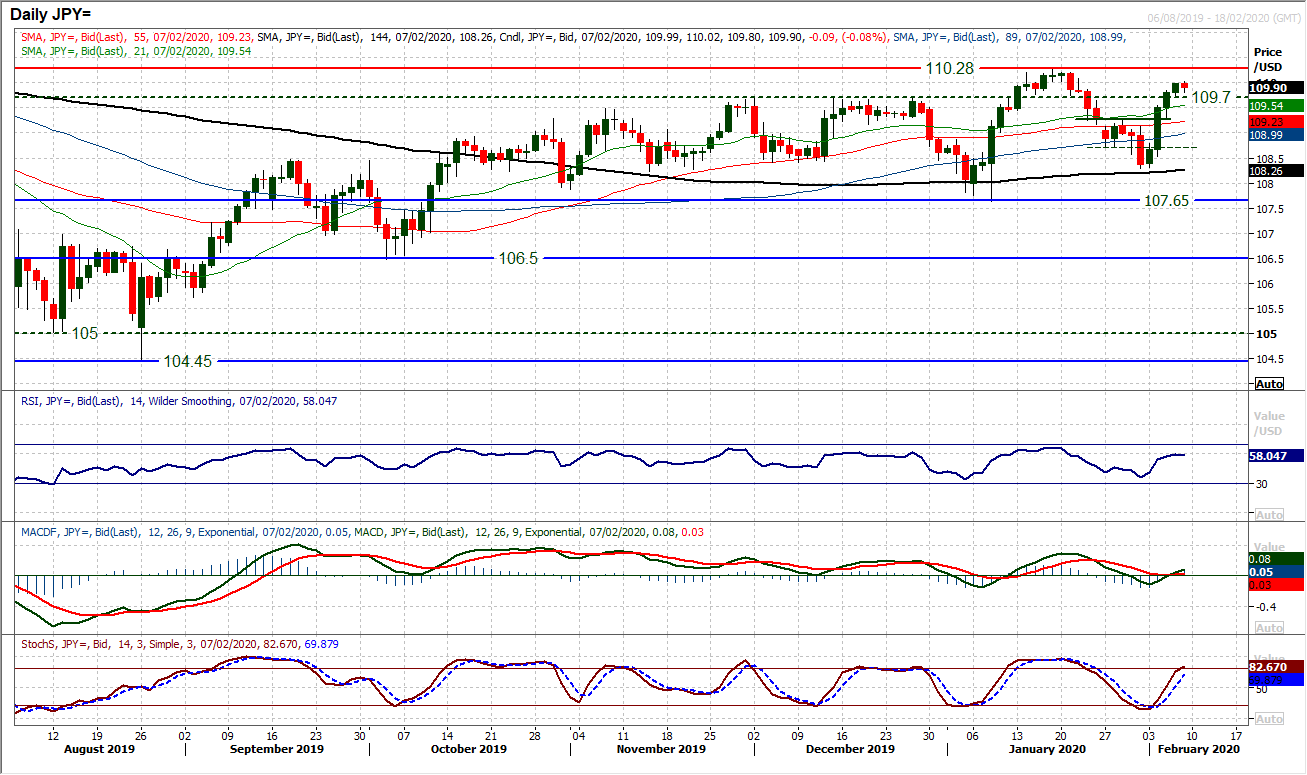
The dollar recovery continues to build, in a move which is holding well above the pivot at 109.70. The bulls are well set up in the rally. Momentum indicators remain on their improving path however, with the RSI still just around 60 (historically bull runs tend to move to the mid-60s), whilst MACD and Stochastics line both have room to run following their respective bull crosses, there is upside potential in this move. However, a degree of consolidation is hinting this morning, as traders prepare for the payrolls report. Although momentum suggests the bulls are positioned to test the key January high around 110.30, intraday corrections should be seen as a chance to buy now. Support is initially at 109.70 above 109.25.
Gold
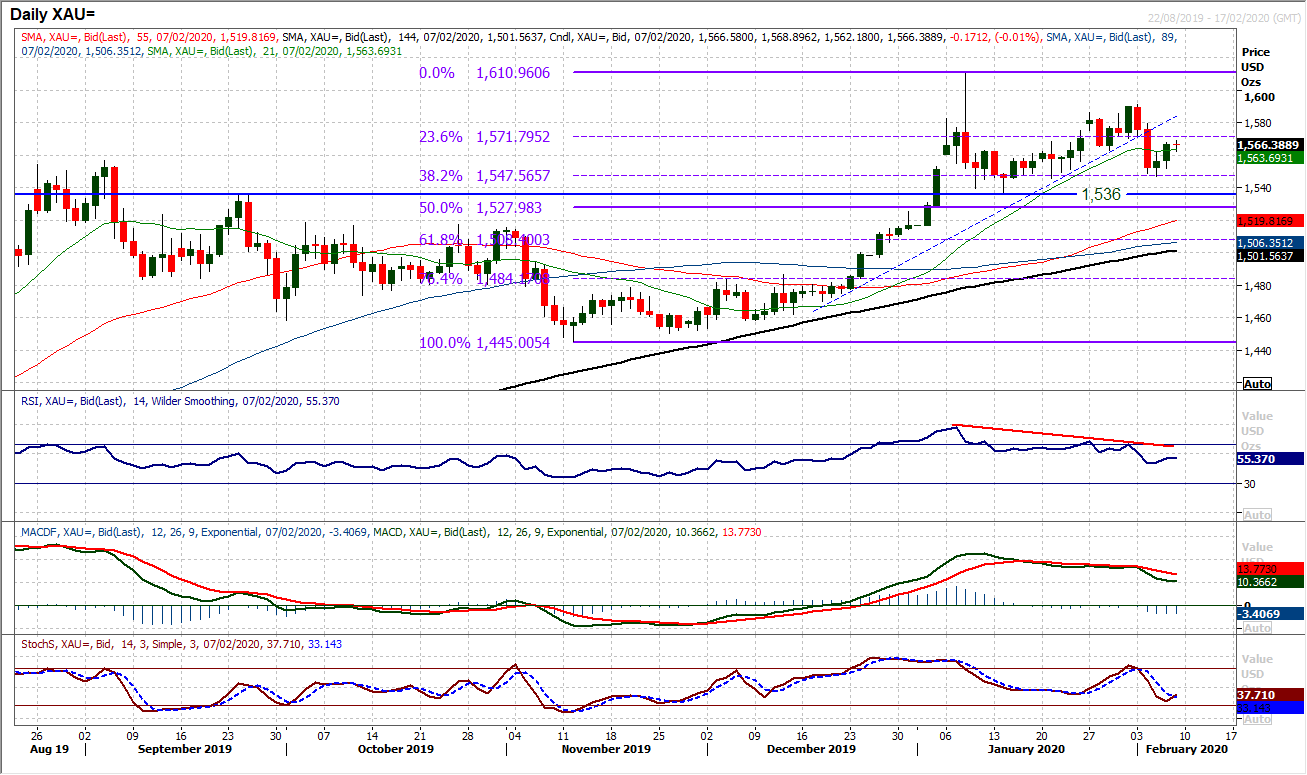
Once the six week uptrend was broken earlier this week, we turned near term neutral on gold. Despite the two marginally positive candles of the past couple of sessions, this is a position we feel continue to favour. This arises from what is an ongoing moderation in momentum indicators over the past few weeks. The RSI and MACD lines are tracking lower back towards neutral areas which suggests that rallies are now more of a struggle to sustain. Our neutral stance holds well as the market trades between the 23.6% Fibonacci retracement (of $1445/$1611) which is now an overhead basis of resistance at $1572, whilst also holding the support of the 38.2% Fib around $1548. An early slip back today is again moderating any renewed recovery momentum and holds the range between the two Fib levels. A third positive candle in a row to close above $1572 would begin to develop a more positive bias once more. The importance of the floor of support $1536/$1546 is growing.
WTI Oil
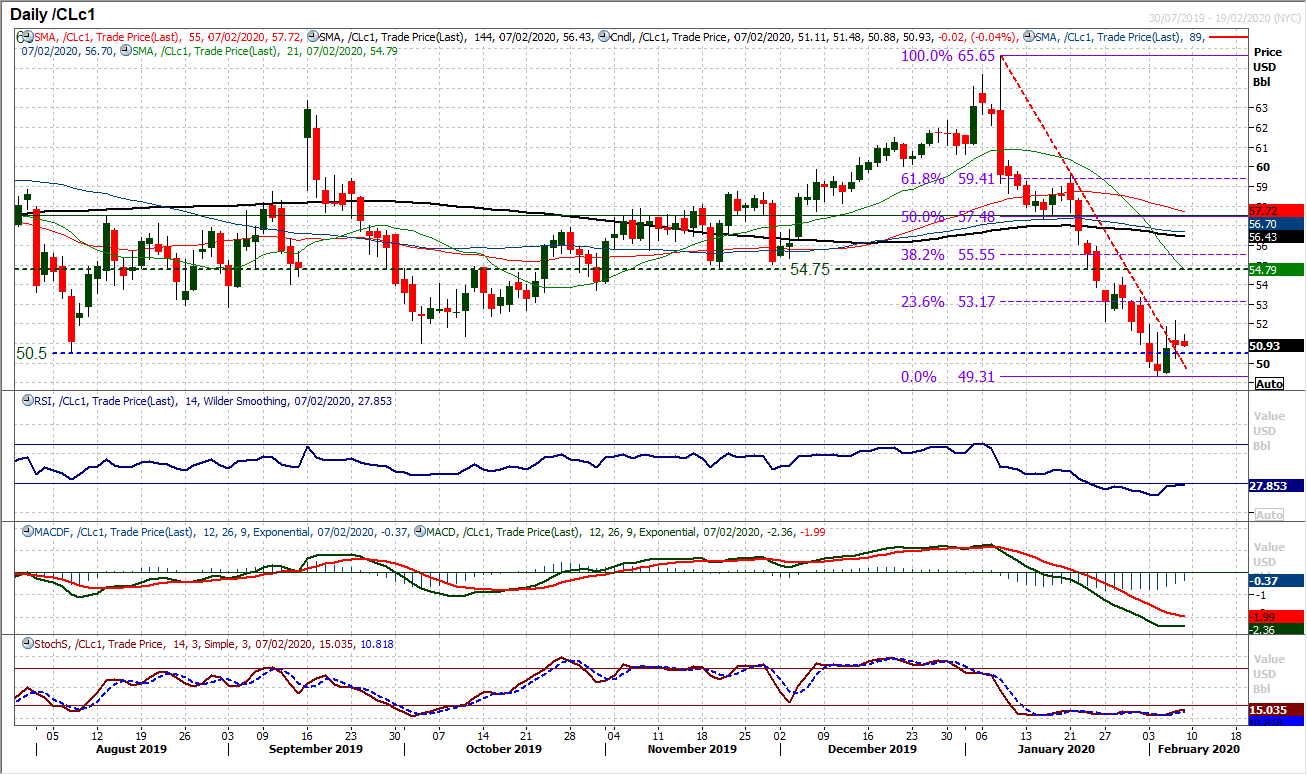
The prospect of a recovery was just put on ice yesterday as what had looked to be a second consecutive positive candle was dragged back into the close. A false start in the rally. However, the strong downtrend of the past few weeks has now been broken, whilst momentum indicators are threatening recovery signals. The importance of the near term resistance now around $52.15 is key. This pivot area would mark the completion of a small base pattern (which would then imply a recovery towards the more considerable resistance around $54.35/$54.75) if the bulls can decisive clear it. Once more, also there will be a focus on $50.50/$51.00 as support. A decisive breach would defer the near term recovery hopes and put pressure back on the recent low at $49.30.
Dow Jones Industrial Average
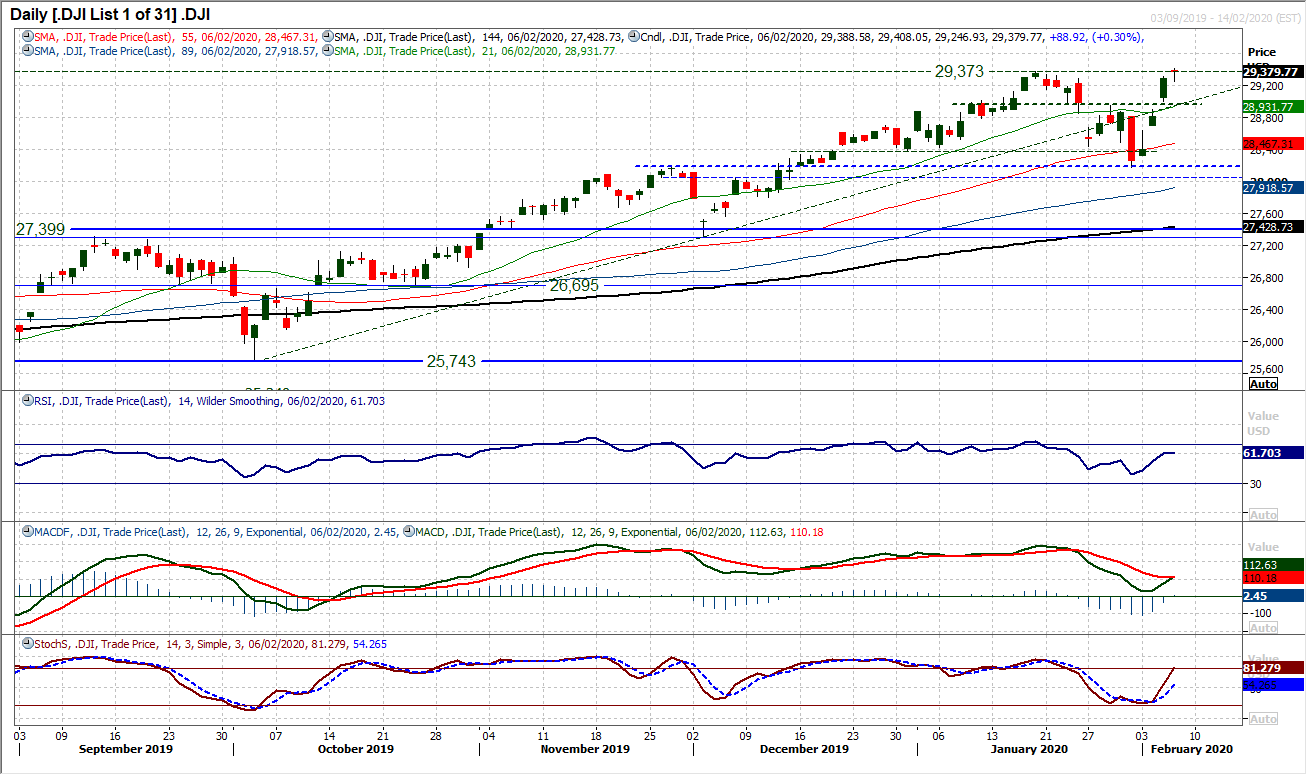
Another positive session has taken the Dow to a new all-time high. However, after the positive candlesticks of previous sessions this week, Thursday’s move was a little muted. Whilst the bulls have been running decisively higher, where filling the opening gaps has not even been contemplated, yesterday’s gap fill could harbour a slowing of the buying impetus. At least, on a very near term basis. Furthermore, the market only crept meekly to an all-time high (by just 6 ticks). Although daily momentum remains very positive and seemingly with upside potential, there could be the prospect of a near term retreat brewing. The hourly chart shows a little fatigue hinting on hourly MACD and hourly RSI both just fading slightly. Essentially, this is once more a very strong looking market and the outlook remains positive, but within this, weakness is still a chance to buy. There is a near term pivot band of support 28,950/29,000 which is an area the bulls will be looking at initially. We anticipate further all-time highs will be seen and a close decisively clear opens 30,000.
