Market Overview
The wild ride of volatility on global markets was given a surprise shot in the arm yesterday as the Federal Reserve shocked everyone with a -50 basis points rate cut. If the idea was to settle the nerves and put a floor under the recent selling pressure, the Fed did not get the required result. The unanimous decision from the FOMC resulted in Treasury yields falling sharply back lower once more (there had been a degree of stability beginning to form earlier in the session yesterday) and Wall Street closed around -3% lower. It seems as though bond markets see the Fed’s decision as a panic move and one that will not be the end of the rate cuts. The 10 year yield which initially knee-jerked to +1.16% fell as low as +0.90% session and into today remains well below +1.00%. The 2 year yield, is now under +0.70%, a loss of around-75 basis points in less than two weeks. As the 2 year yield continues to fall today, the market is pricing for something more from the Fed. The question is why move now and what does a change to monetary policy achieve when what is happening with Coronavirus is a supply-side shock? Overnight the China Caixin Services PMI plummeted to 26.5 (48.0 exp, 51.8 in January) and this will play into the concern over how global supply lines are being impacted. Back in the US, even in the face of falling Treasury yields, the dollar is rebounding today. This is also as equity markets seem to be bounding too. Services PMIs for Europe and the US will be in key focus for traders today.

Wall Street fell sharply on the back of the Fed rate cut. The S&P 500 closed -2.8% lower at 3003, but US futures are rebounding today by +1.5%. This has helped to stabilise Asian markets were the Nikkei was +0.1% and Shanghai Composite +0.6%. European markets are also set up for mild early gains with FTSE futures +0.7% and DAX futures +0.6%. In forex, USD is performing well on the G4 majors, with EUR slipping back after huge recent gains. It is also interesting to see AUD performing well as Australian Q4 GDP came in ahead of expectation. In commodities, after a huge rebound yesterday, gold is giving up around -$4, but the recovery on oil is still in progress around +0.5% higher today.
The economic calendar is packed with the services PMIs today. The February Eurozone final Services PMI is at 0900GMT and is expected to remain at 52.8 (flash 52.8, final 52.5 in January) whilst the final Eurozone Composite PMI is expected to be confirmed at 51.6 (51.6 flash, 51.3 final January). At 0930GMT the final UK Services PMI is expected to be unrevised at 53.3 (which would be slightly down from the final January reading of 53.9). This would mean the final UK Composite PMI being confirmed at 53.3 (53.3 flash, which would be unchanged from the final January reading of 53.3). In the US ISM Non-Manufacturing is at 1500GMT and is expected to slip slightly to 54.9 (from 55.5 in January) but given how the Fed cut yesterday, perhaps this may be a miss to the downside here. The Bank of Canada has a decision to make today in its monetary policy at 1500GMT. The consensus is not expecting a rate cut from the 1.75% but given the FOMC decision, it would be a surprise if there was not something potentially similar from the BoC. EIA crude oil inventories at 1530GMT are expected to show a build of +3.3m barrels (+0.5m barrels last week).
Chart of the Day – AUD/USD
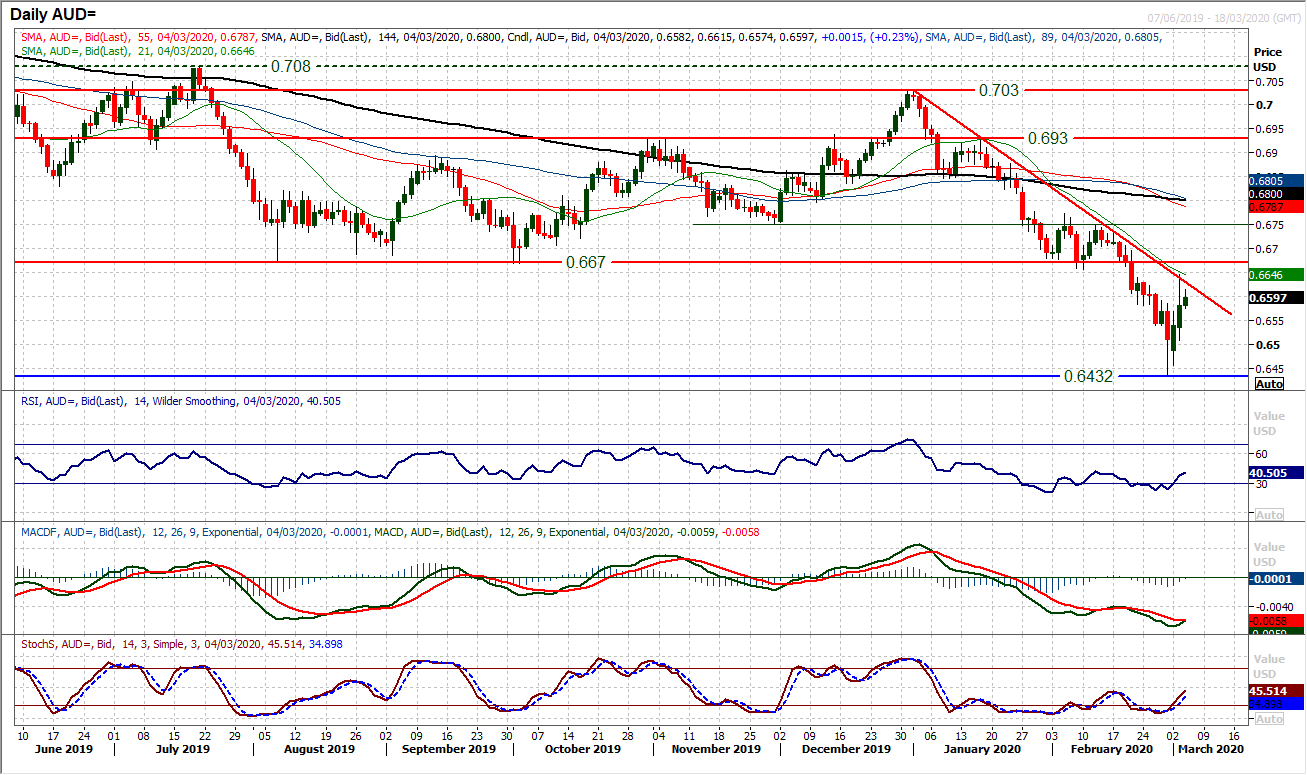
What a day for the Aussie. First of all, the RBA cuts rates and the Aussie pushes higher. Then on the surprise Fed rate cut, the Aussie pushes even higher. The result has been a big rally on AUD/USD. The move has already engaged a sizeable rebound from the $0.6430 low of Friday and is now developing technical recovery signals as key resistance is tested. Momentum indicators are in recovery, with the RSI back around 40 following a stint below 30, Stochastics are similarly pulling higher and the MACD lines on the brink of a bull cross. However, more needs to be done to suggest this is a sustainable recovery. What needs to be seen is a breach of the 8-weeks downtrend and the falling 21-days moving average (today around $0.6645 which flanks the downtrend and is a basis of resistance) to suggest the bulls are capable. However, the key test would be the resistance at $0.6670 which is overhead supply of numerous key lows on Aussie/Dollar from August to February. How the bulls respond around this big resistance will be crucial for the medium term outlook. The hourly chart shows a basis of a near term support at $0.6540/$0.6570 which needs to hold for the recovery momentum to build. Below $0.6505 re-opens the downside once more.
EUR/USD
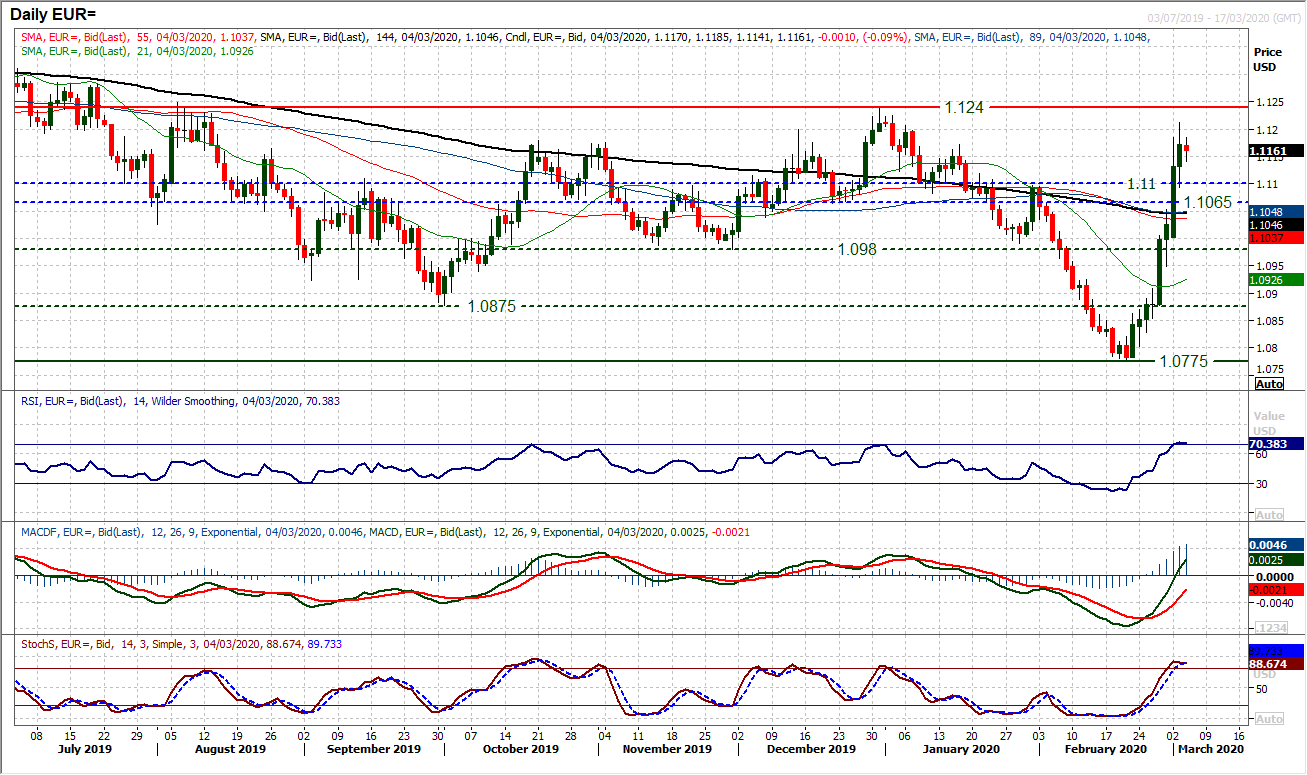
The euro closed another session with good gains yesterday as EUR/USD pulled to test the resistance band $1.1200/$1.1240. However, it is interesting that once more we come into the European session with the euro slightly on the back foot. This happened yesterday morning until the surprise Fed rate cut helped the euro higher into the close. However, are there initial signs of fatigue in the run higher forming? The initial look at $1.1200/$1.1240 did not last long before the market drifted off again. The RSI is threatening to roll over around the 70 mark (which is extreme for this pair), whilst Stochastics are similarly just drifting over. It is still early, but there are slight signs on the hourly chart of negative divergence and potential fatigue. If the hourly RSI begins to fall below 40 this would now be a corrective signal. The support of yesterday’s low around $1.1095 will take on an important role in this scenario. A breach of the support, could signal renewed profit-taking. After such a surprise and strong run higher, profit-taking would not be out of the question.
GBP/USD
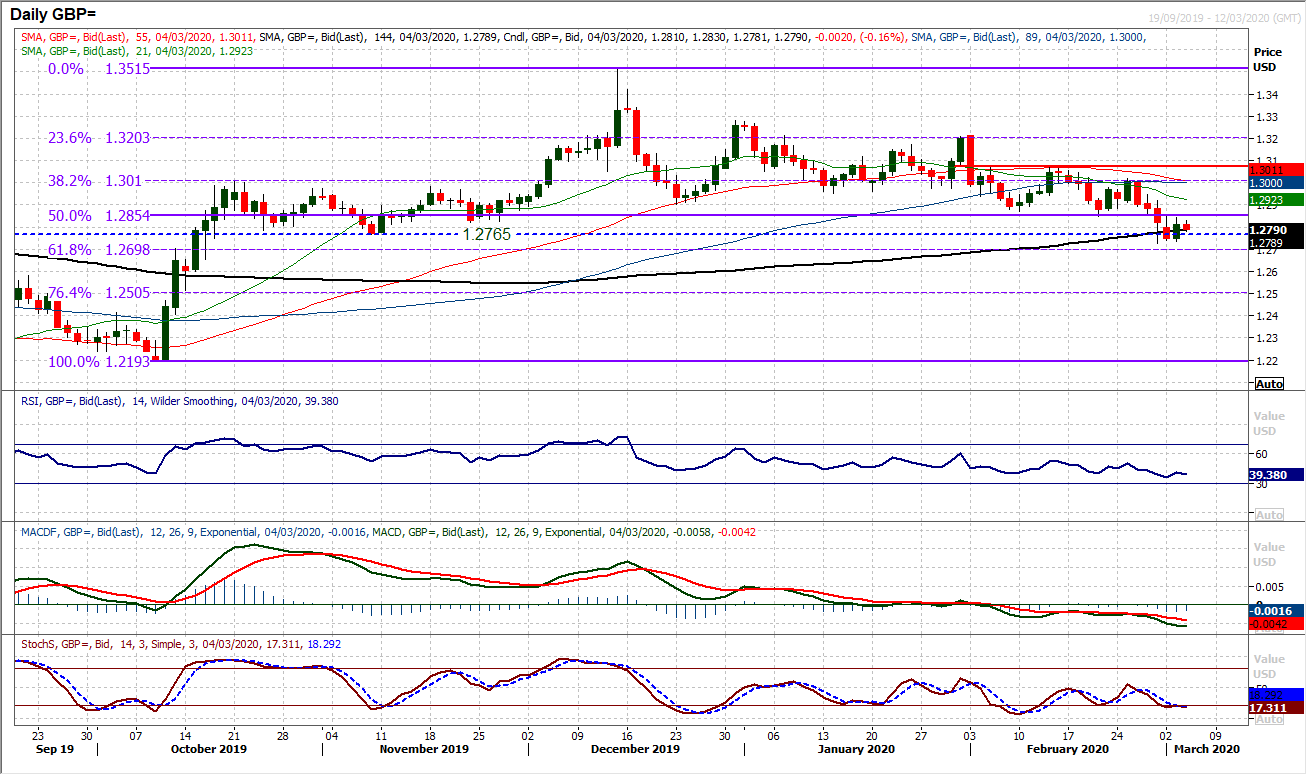
Cable ticked higher yesterday, but the outlook remains under pressure. Given the surprise Fed rate cut, the outlook for Cable has barely been impacted at all. A slight positive bull candle was posted, but essentially was simply unwinding Monday’s decline. Daily momentum indicators show little appetite for recovery and suggest that rallies remain a chance to sell. The hourly chart shows a basis of consolidation continues under the overhead supply around $1.2850. How the sterling bulls respond this morning could be key, as already the hourly momentum indicators are beginning to roll over again as the market backs away from the $1.2850 resistance. There needs to be a rally to breach $1.2920 at least (the first real lower high of the hourly chart) to suggest the bulls are even remotely serious in a recovery. That aside, our bias remains to the downside and pressure on $1.2725 and the 61.8% Fibonacci retracement (of $1.2193/$1.3515) at $1.2700.
USD/JPY
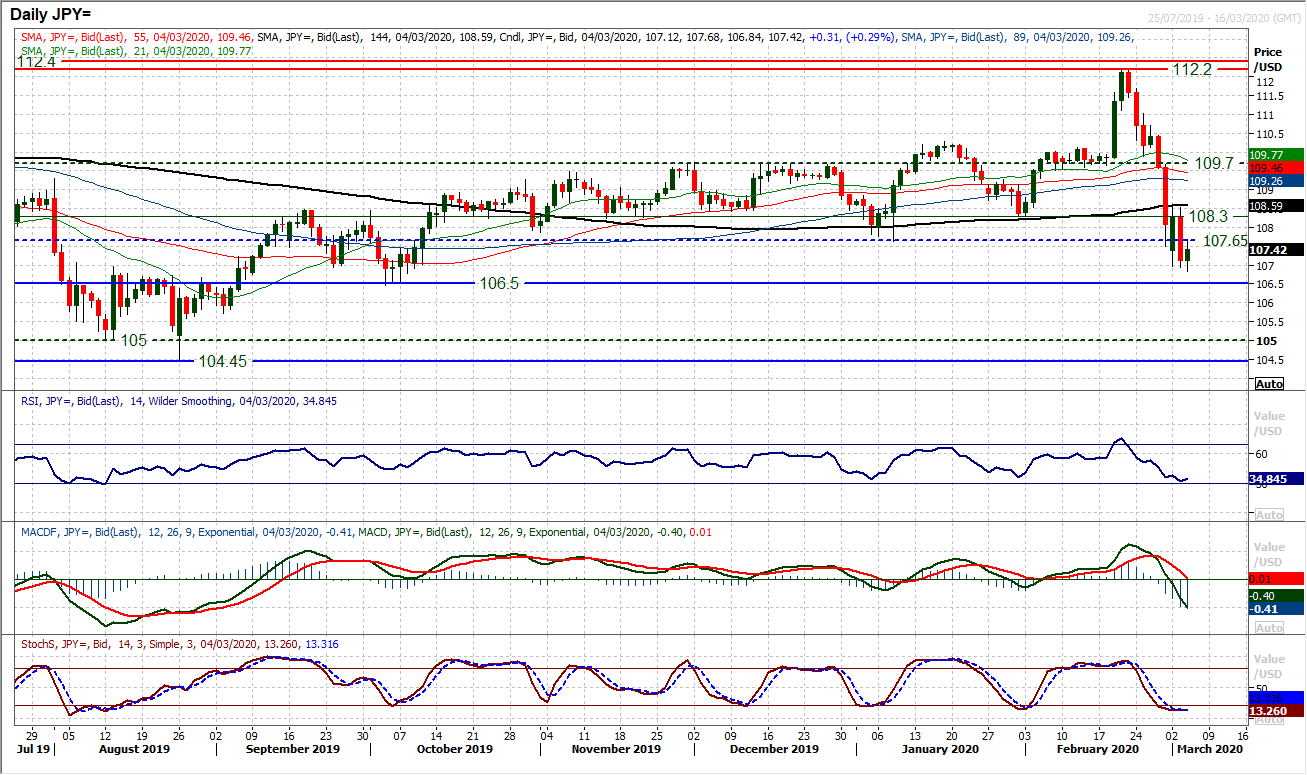
A wild ride for USD/JPY continues. The Average True Range is over 100 pips and is the highest since January 2019 and is extremely stretched. It had looked as though the market had been beginning to build support, but the Fed rate cut has put that move on ice. A close below 107.65 has opened the next support at 106.50. However, the market remains stretched and the RSI is in the low 30s where the buying pressure resumed in January and February. The Stochastics are also shallowing. With the market ticking slightly higher into the European session, the potential for recovery has not been entirely extinguished. The hourly chart shows chinks of light on momentum indicators, with prospective positive divergences on hourly RSI and MACD. Watch for the hourly RSI moving into the 60s and MACD decisively above neutral. The key resistance is around 108.55 which a breakout would constitute a small base pattern. In the absence of these conditions being met, the outlook remains under negative pressure. Given the overhead supply on the daily chart between 107.65/108.30, it is tough going for the bulls right now.
Gold
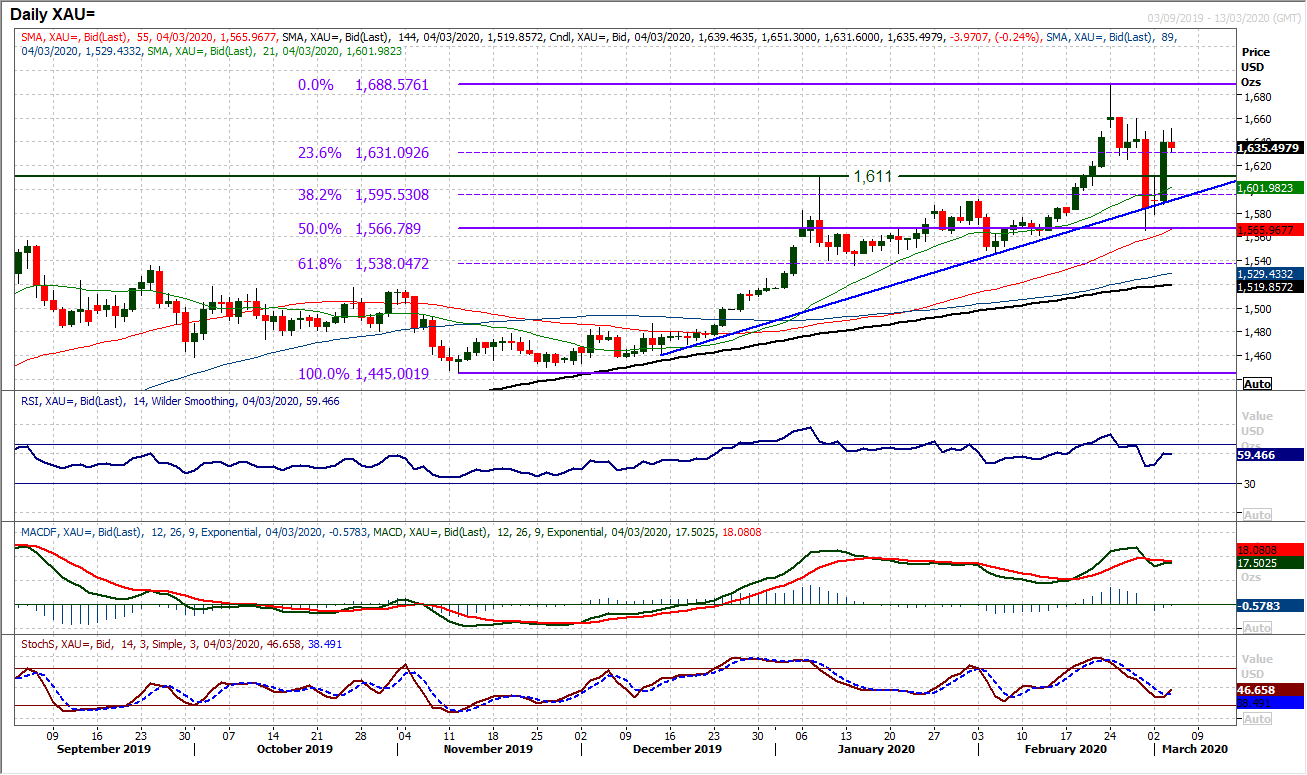
Pretty much exactly a week ago, gold was trading fairly quietly around $1640. If you had missed the passed week, you would be forgiven for not knowing what all the fuss has been about. However, another wild day of volatility on global financial markets and the gold price has shot back higher on the surprise Fed rate cut. We have been discussing the prospect of buying gold into weakness, but we did not envisage the moves that we have seen to get here. The uptrend support has kicked in (today around $1590) whilst momentum indicators are ticking higher again. The RSI back above 60 (from 50) is positive, whilst Stochastics also ticking higher, around the levels they were at as the February rally kicked in. We still favour long positions from here, but given the wild volatility shows little sign of settling down, we cannot rule out further weakness that would be a chance to buy. The hourly chart shows an old low around $1625 has been a basis of support in the past 12 hours.
WTI Oil
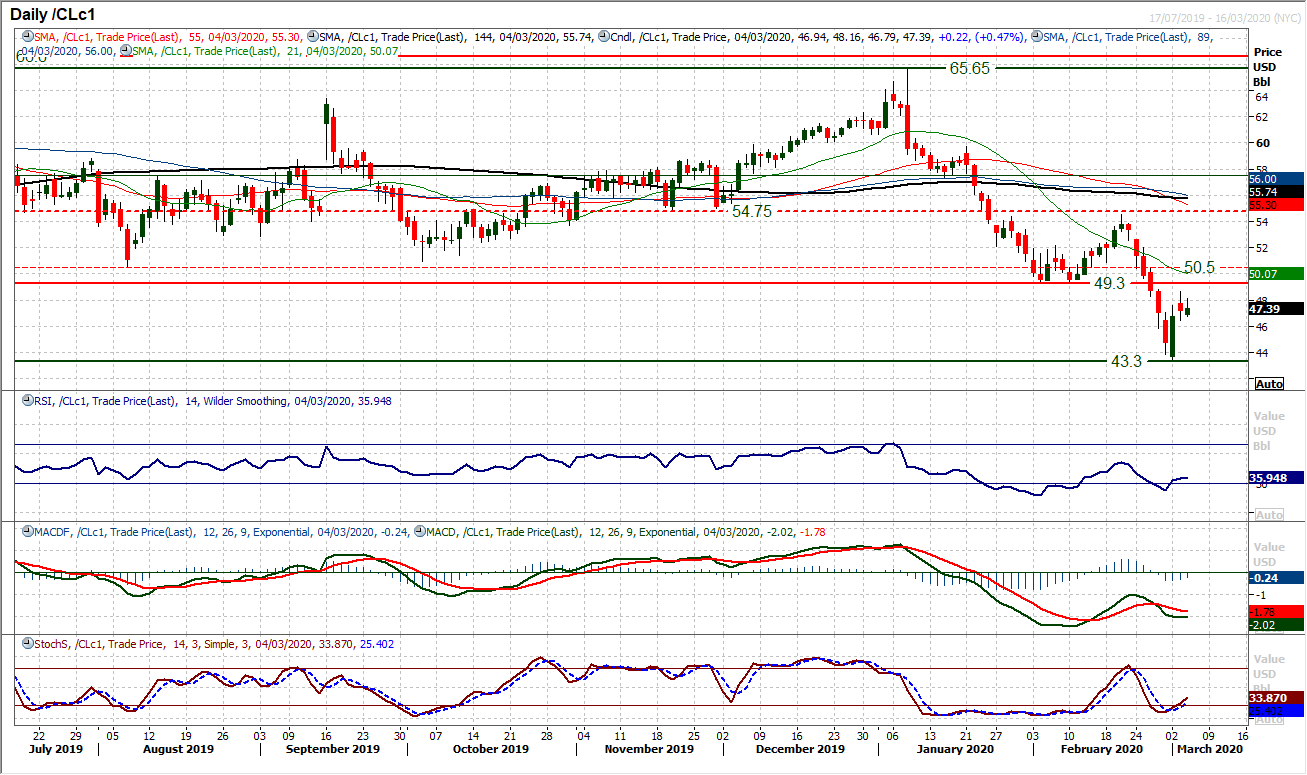
Oil continued to rally yesterday, with another positive close. The move was certainly helped by the surprise Fed rate cut, but already the market had been developing on the strong bull candle of Monday. However, a slight negative candle (close below the open) is a warning for the bulls that this recovery is still built on shaky ground. Despite this, two positive sessions in a row means that the market is beginning to post improvements on momentum signals. The RSI edging towards 40 (having been below 30), with the Stochastics turning higher and MACD lines showing signs of bottoming. The market trading higher early today is building on these signals. The hourly chart shows the need for $46.00/$46.45 support to now hold. Initial resistance is $48.65 but the key test lies overhead though, with the old supports between $49.30/$50.50 which house significant overhead supply.
Dow Jones Industrial Average
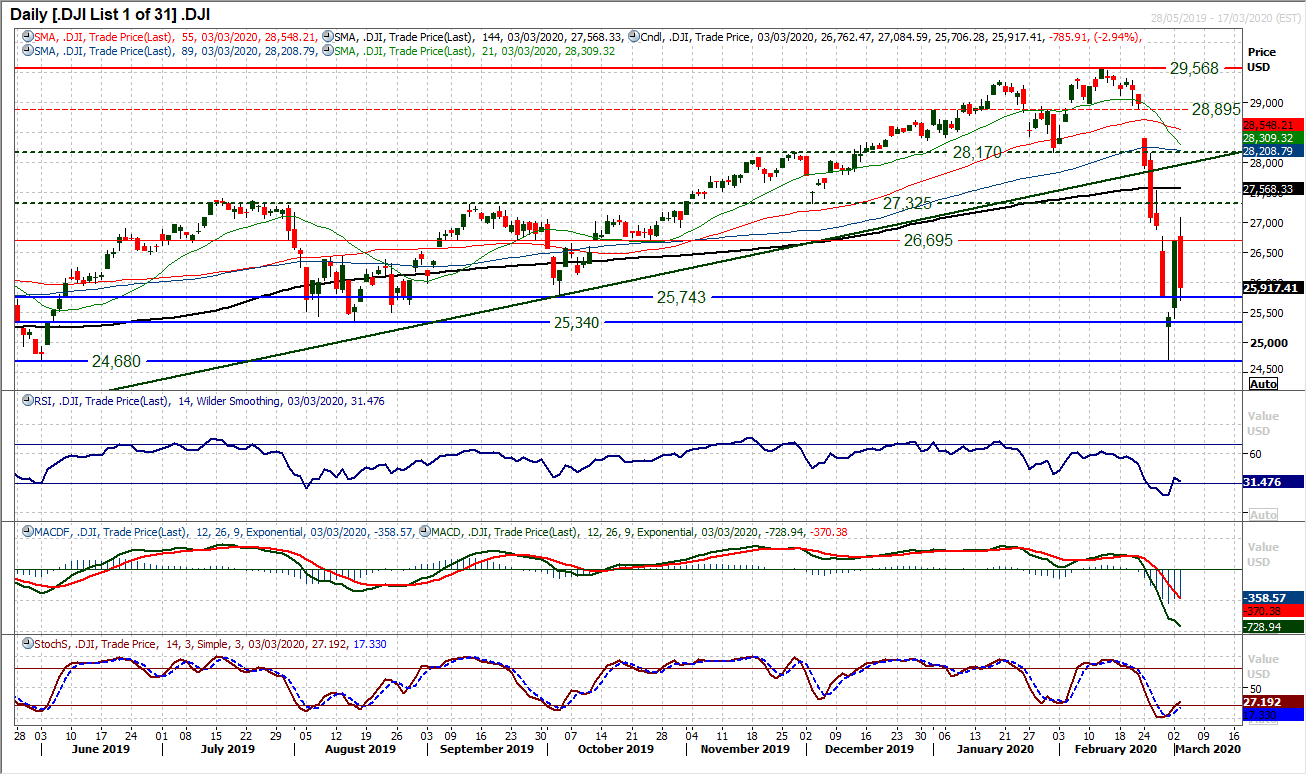
Wall Street did not take kindly to the surprise -50bps Fed rate cut. After an initial bump to the upside, the Dow closed almost -3% lower last night. The wild ride on equities continues. The Average True Range is now at 695 ticks which is above the record levels of October 2008. Admittedly, in 2008 the Dow was much lower, around the 10,000 mark but still, volatility is massive right now. It is difficult to argue convincingly that this is a market moving on near term technical right now, it is more a sentiment and newsflow play. As things stand, approaching the European session, futures are calling the Dow back higher again and the volatility looks set to continue. Stochastics turning higher is a positive though, but not enough to suggest the market is in decisive recovery. Arguably there is now resistance in the band 26,695/27,085 which is the barrier now a gap from 26,890 was filled yesterday. Support is at another filled gap at 25,495/25,705.
