Market Overview
As traders get back to their desks following a long Easter weekend, they are met by markets hinting at a fairly constructive appetite for risk. The discussion over exit strategies across the major economies following their periods of lockdown is playing into this improvement in market sentiment, as has better than expected Chinese trade data. With several countries in Europe now beginning to ease lockdown restrictions, President Trump suggests that the US is close to completing its own plan to re-open the country. However, we will begin to get some clarity on the scale of the impact on first quarter corporate data as earnings season kicks off this week. It could make very sobering reading. The big banks report this week, with JP Morgan and Wells Fargo in focus today. Furthermore, although the recovery on equity markets continues today, there is still a significant risk that they are simply bear market rallies. We have not seen the scale of second wave of COVID-19 infections/deaths yet, something that should become a factor as economies reduce restrictions on the movement of their populations once more. For now, the recovery is still progressing, but for how long? Treasury yields are higher, the US dollar less strong, and equities also stronger. After a weekend of tense negotiations amongst major oil producers, driving price volatility, oil is relatively settled today. With estimates of well over 20m barrels of oil per day out of demand, are the OPEC+ production cuts even going to make a difference?

Wall Street closed lower last night (S&P 500 -1.0% at 2761) but with the E-mini S&P futures +1.2% today there is a decent look to the equities space this morning. Asian markets were positive (Nikkei +3.1%, Shanghai Composite +1.4%) whilst European markets are around 1% higher in early moves. In forex, there is a mild risk positive bias with USD slightly negative across the majors (aside from the underperforming JPY). In commodities, oil is supported early today around a half to 1% higher, whilst gold and silver are trading around the flat line.
There are no key economic data releases schedules for today.
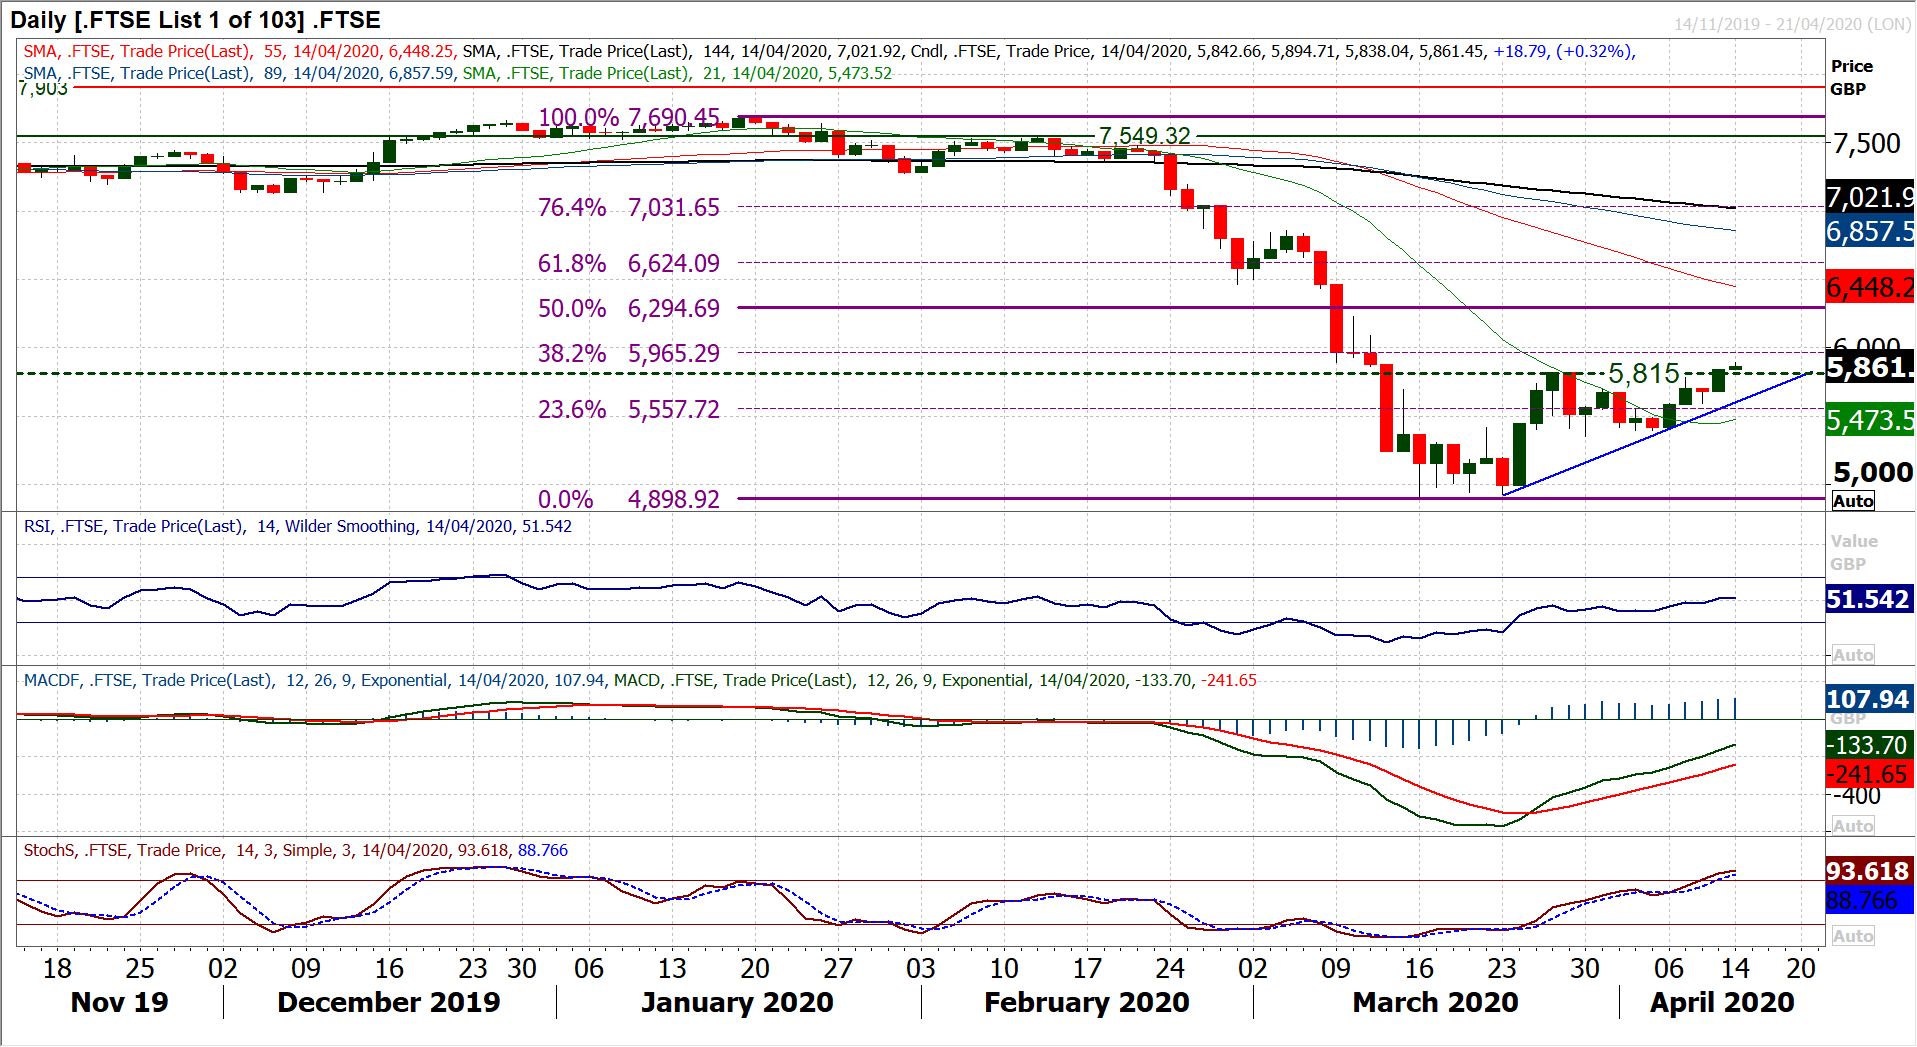
Chart of the Day – FTSE 100
With a strong move higher into Thursday’s close, the FTSE 100 finally managed to follow other major indices in a breakout above the initial March recovery high. Now for the more important part, holding on to the breakout. Futures are looking promising early today as the bulls look to confirm a sustainable breakout. The technical set up is also encouraging, with RSI at a two month high above 50, whilst MACD and Stochastics are also well set in their recoveries. In the wake of last week’s move above 5815, there is now a run of higher lows and higher highs, which is a new trend formation. If the market closes back below the 5815 breakout, it will be a disappointment, but whilst a three week recovery trend is intact, the bulls will remain encouraged (comes in at 5600 today) to buy into weakness. Support of a higher low at 5590 adds further weight to this trend, whilst on the hourly chart momentum is still in recovery mode (RSI consistently bottoming 40/50). So we would still be looking to use any intraday weakness into support as a chance to buy. For upside targets, the 38.2% Fibonacci retracement (of 7690/4899) is the immediate target at 5965 but there is very little resistance overhead and 50% Fib (the equivalent of around where the S&P 500 currently sits) at 6295. Holding above the 23.6% Fibonacci retracement at 5558 maintains the recovery outlook for recovery. Ultimately, though the key will be sustaining the key higher low at 5352.
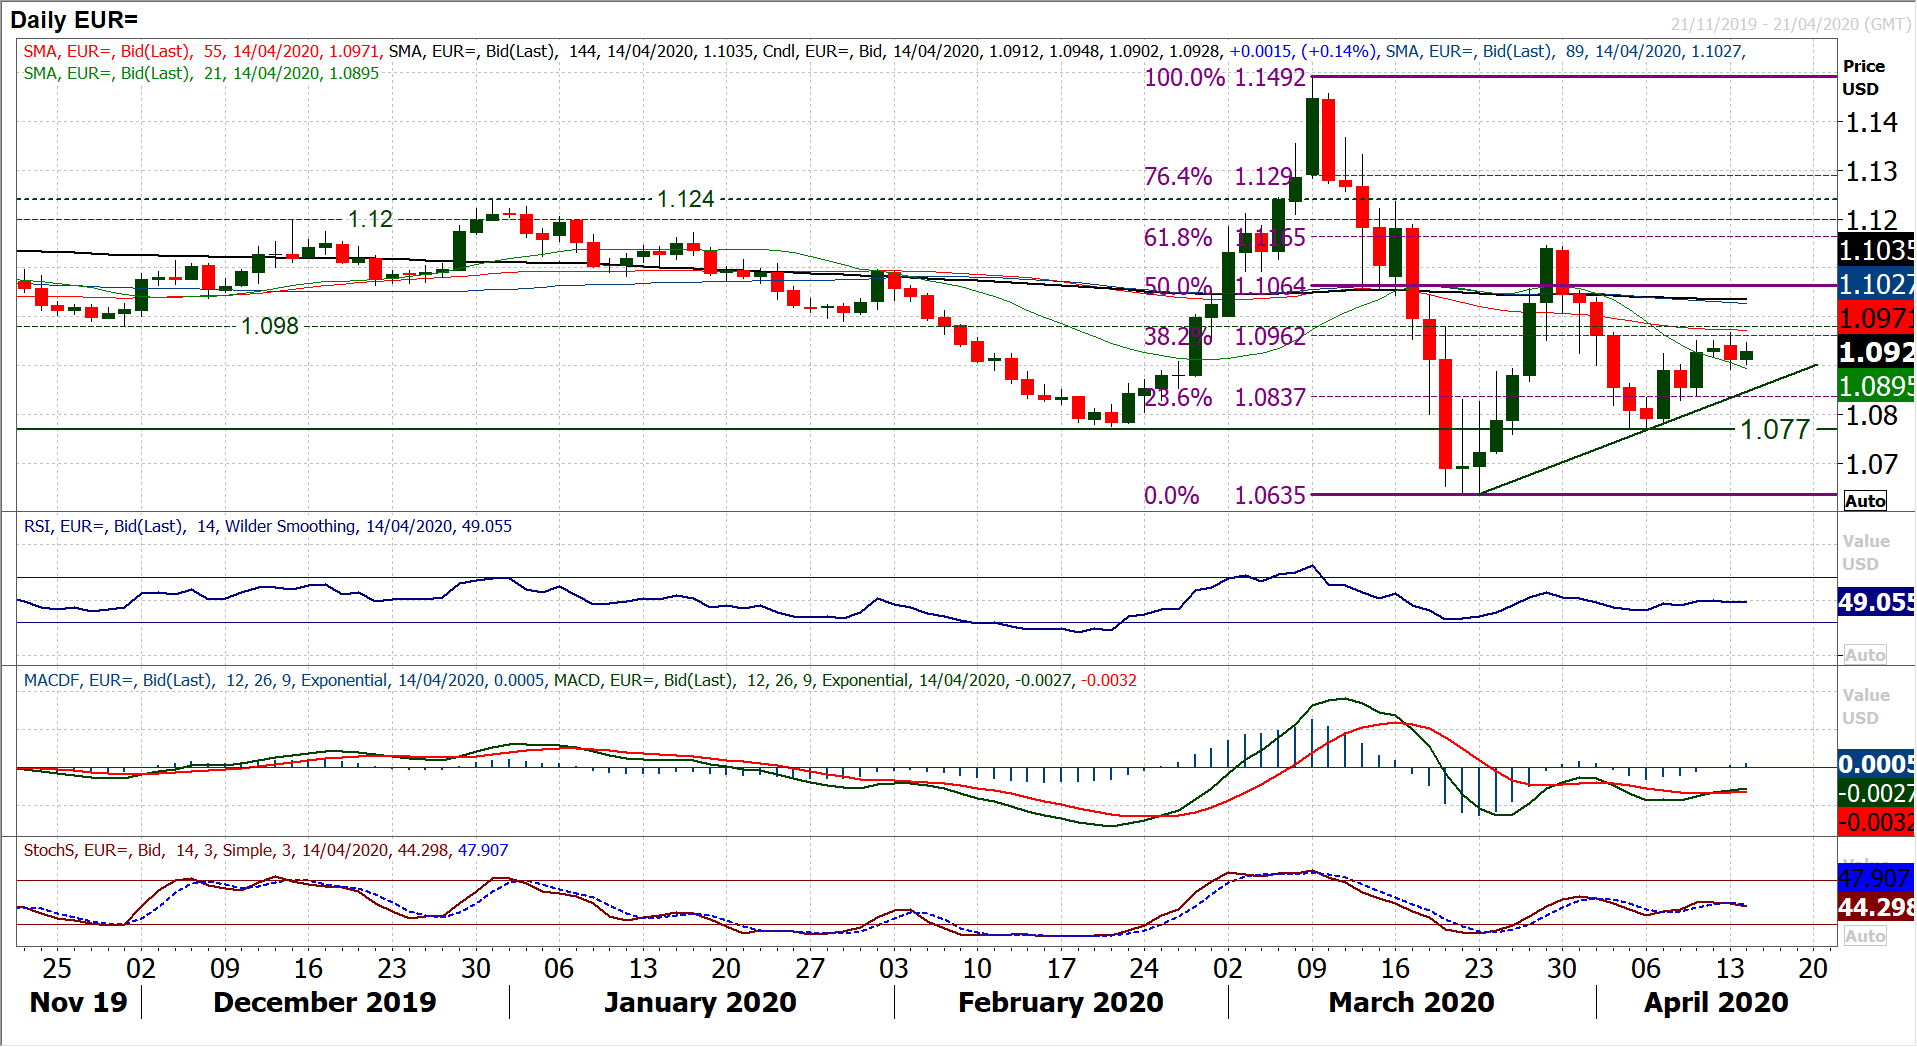
EUR/USD
The technical rebound on EUR/USD looks on shaky ground, but for now it is still holding. The bounce off $1.0770 has been choppy with a mix of candles (although the Easter holiday period could certainly be playing into that). We have been talking about the resistance band $1.0900/$1.0970 in recent sessions and the failure (admittedly during thin trading) around $1.0970 yesterday will raise some doubt for the bulls. Pivot resistance along with the 38.2% Fibonacci retracement (of $1.1492/$1.0635) around $1.0960 and the old key floor from Q4 2019 at $1.0980 means that the importance of this barrier is elevated coming out of the Easter long weekend. Momentum indicators are uncertain of the rebound too, with RSI, MACD and Stochastics all showing a mix of signals, mostly around neutral configurations. With a bounce early today, it leaves EUR/USD at an interesting juncture. Continued failure around here in the $1.0925/$1.0970 band will increase negative pressure back towards $1.0770/$1.0835 once more. For now, hourly indicators are fairly neutrally configured with hourly RSI sitting between 40/65. Moving clear above $1.0970 opens upside for the 50% Fib at $1.1065. Initial support at $1.0890 now. For now the recovery remains in process, but we remain sceptical of how long a euro rally may last for and the longer the weight of resistance around $1.0970 lasts for, the harder the bulls will find a breakout.
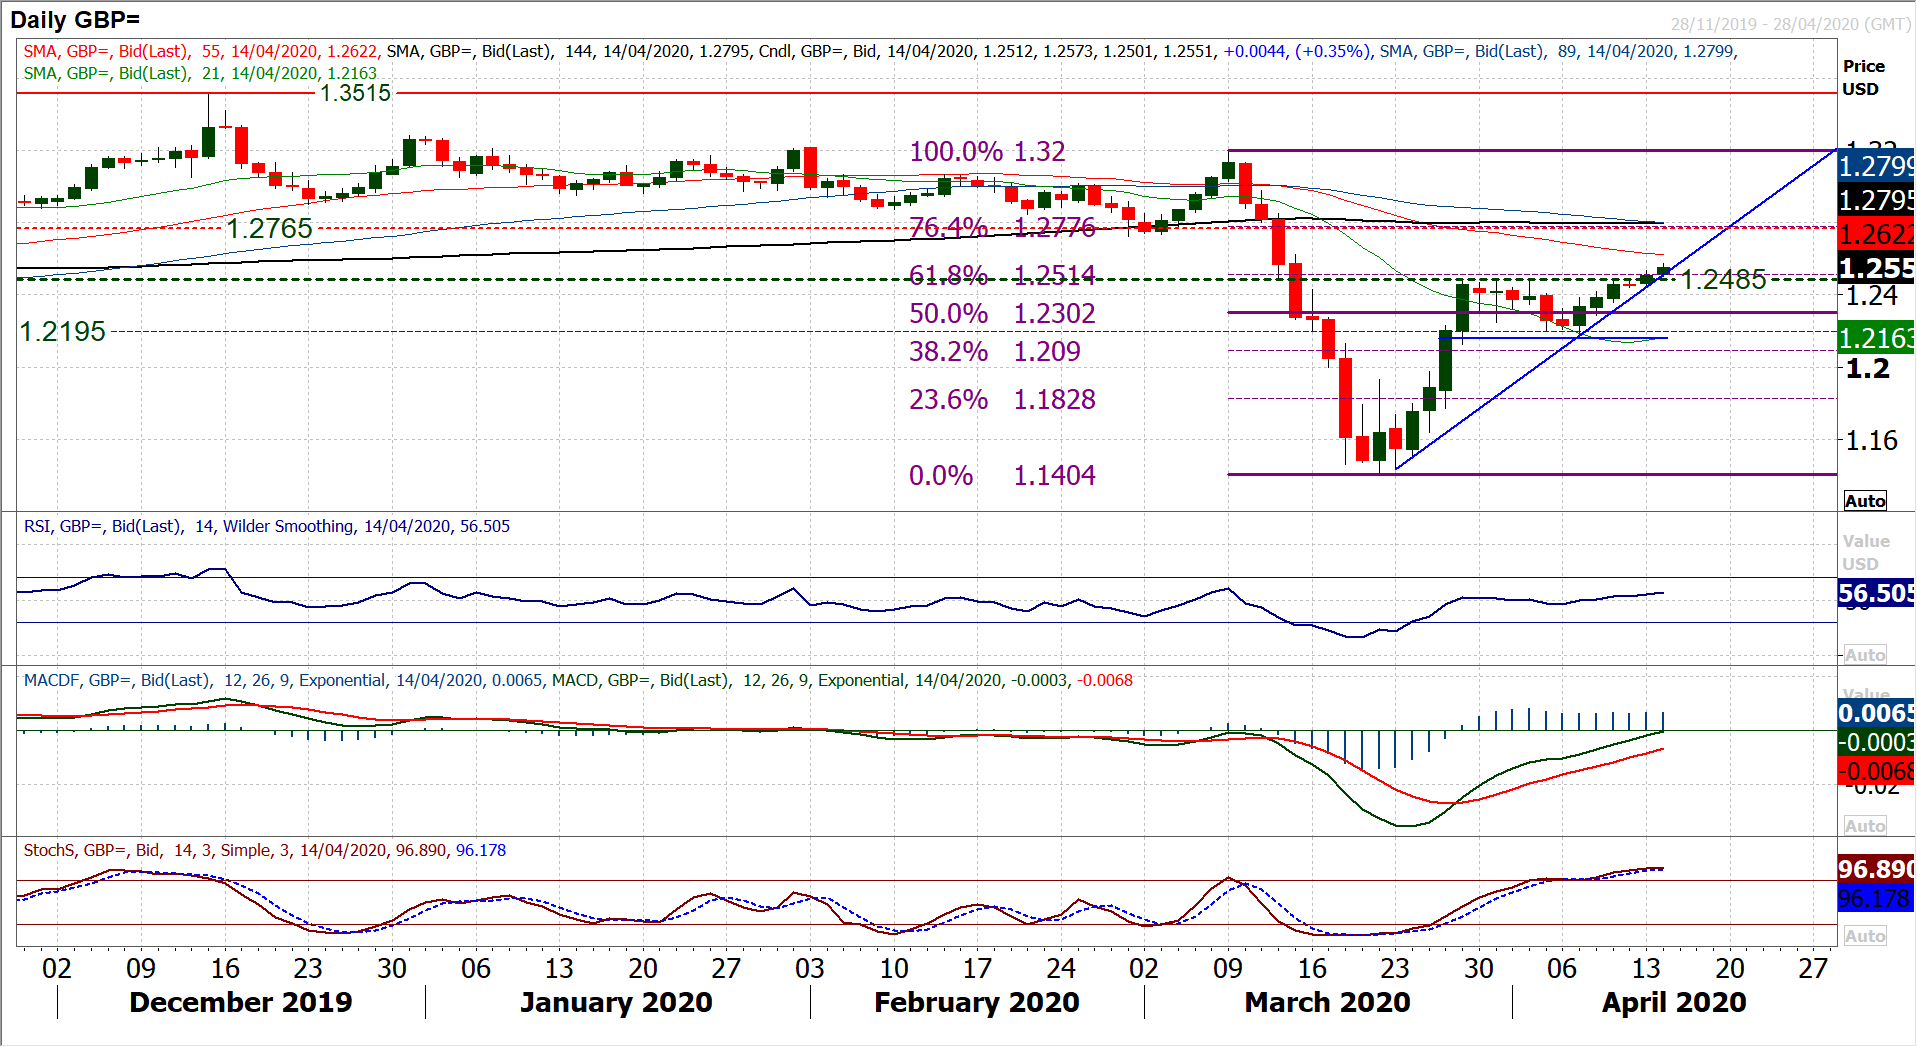
GBP/USD
Sterling has had a strong run higher in the past week. A string of positive candles (leaving aside a non-event of a session on Friday’s bank holiday) has now resulted in a decisive breakout above resistance at $1.2485. The move has formed a sharp uptrend which can actually also be linked back to the key March lows too. The bulls will be looking at the breakout of what can be considered to be a consolidation rectangle between $1.2160/$1.2485 which derives a further +325 pips of recovery towards the $1.2800 area. The breakout also clears the 61.8% Fibonacci retracement (of $1.3200/$1.1405) at $1.2515 to open 76.4% Fib at $1.2775. The move also sees little real resistance until $1.2725/$1.2765. Daily momentum indicators are with the rally, as RSI confirms the breakout, although a move above 60 would give the bulls more confidence. Looking to buy into weakness now, with the hourly chart showing breakout support at $1.2440/$1.2485. Anything supported around 45/55 on hourly RSI has been an opportunity in the past five sessions.
USD/JPY
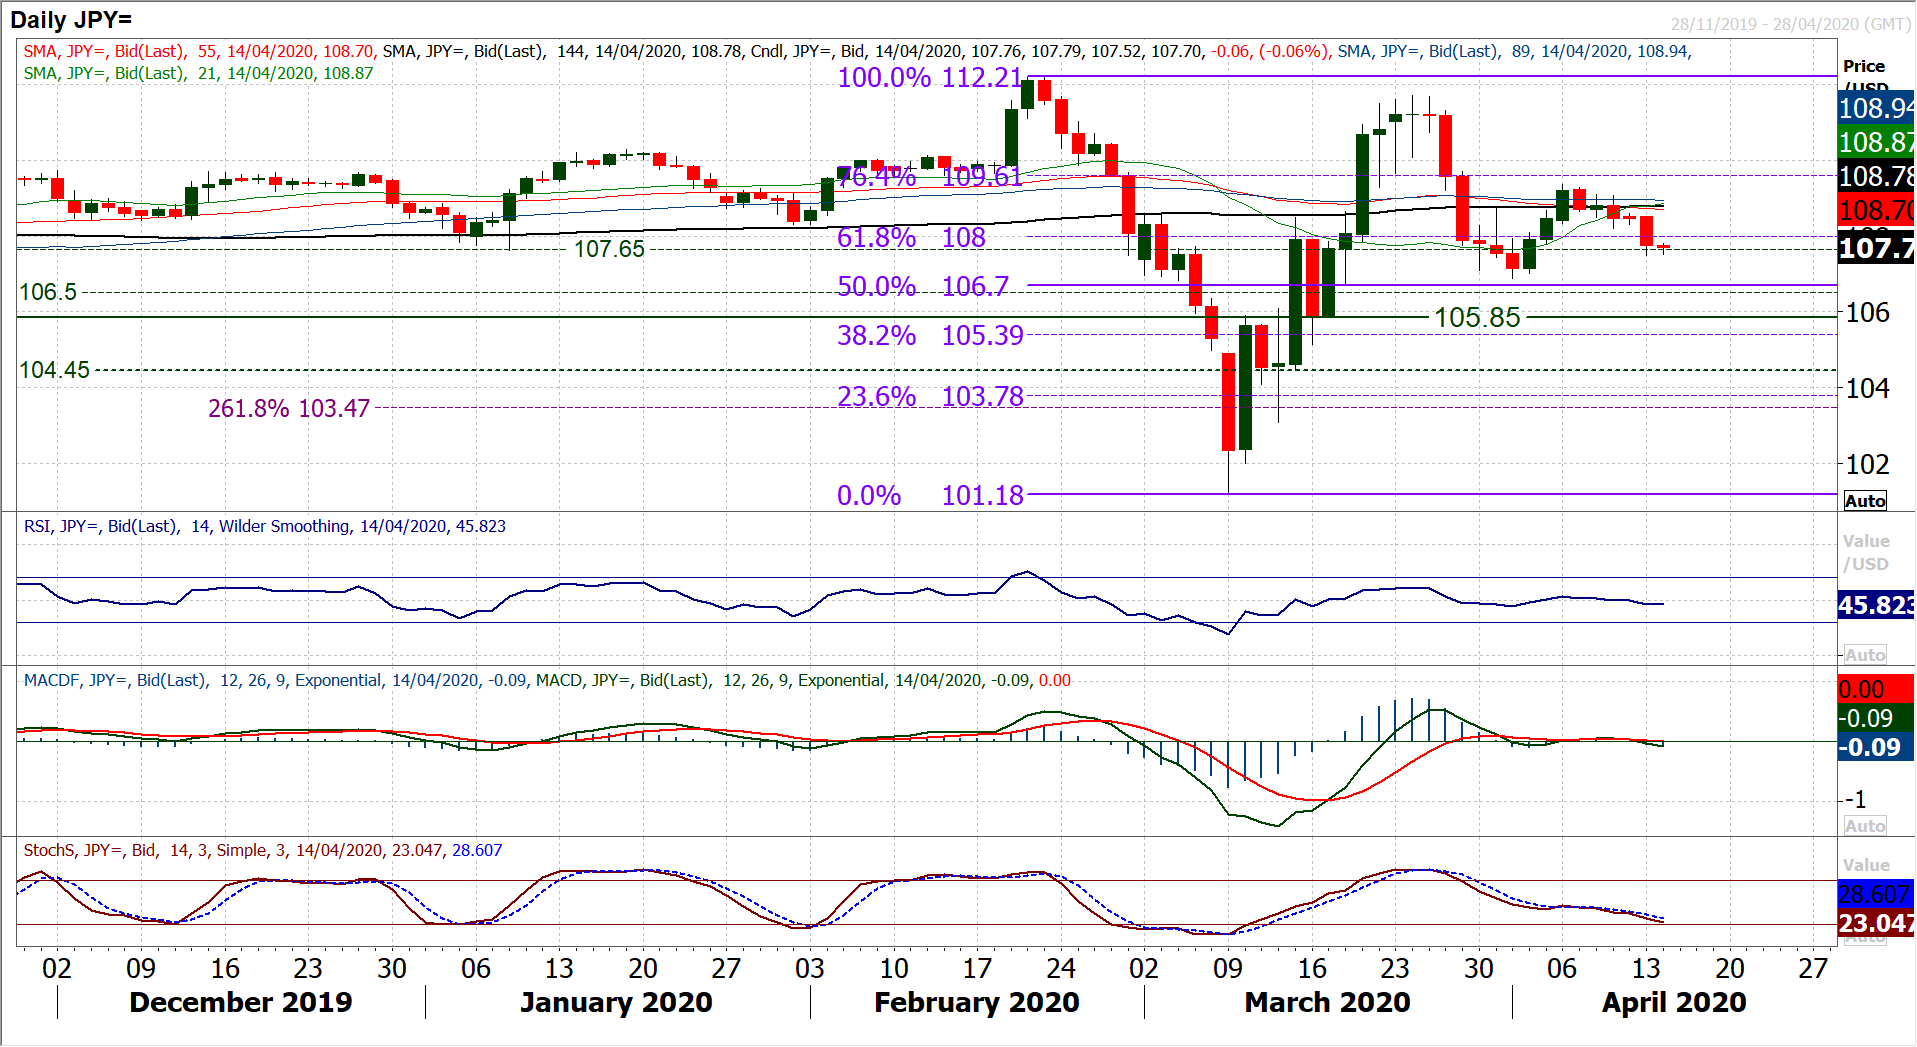
The dollar has been struggling more in recent sessions and USD/JPY faltering back under 108.00 is renewing the negative pressure. With a growing run of lower daily highs and a re-emergence of negative daily candlesticks, downside momentum is taking hold once more. This is pulling RSI, MACD and most pertinently Stochastics lower once more. The support of the 106.90 key reaction low is coming under threat and how the market responds could become a key moment in the near to medium term outlook. A decisive closing breach of 106.90 would leave the formation of key lower highs and lower lows in the past three weeks and a new bear trend formation. Already we see 109.35 being left as key resistance, but the hourly chart shows 108.50/108.70 is becoming further important resistance and a failure at 108.10/108.20 adds further weight to the growing negative sentiment. Intraday rallies have become a chance to sell once more, as any bounce on hourly RSI towards 40/50 has become restrictive. This renewed negative outlook will remain in place whilst the resistance at 108.70 does.
Gold
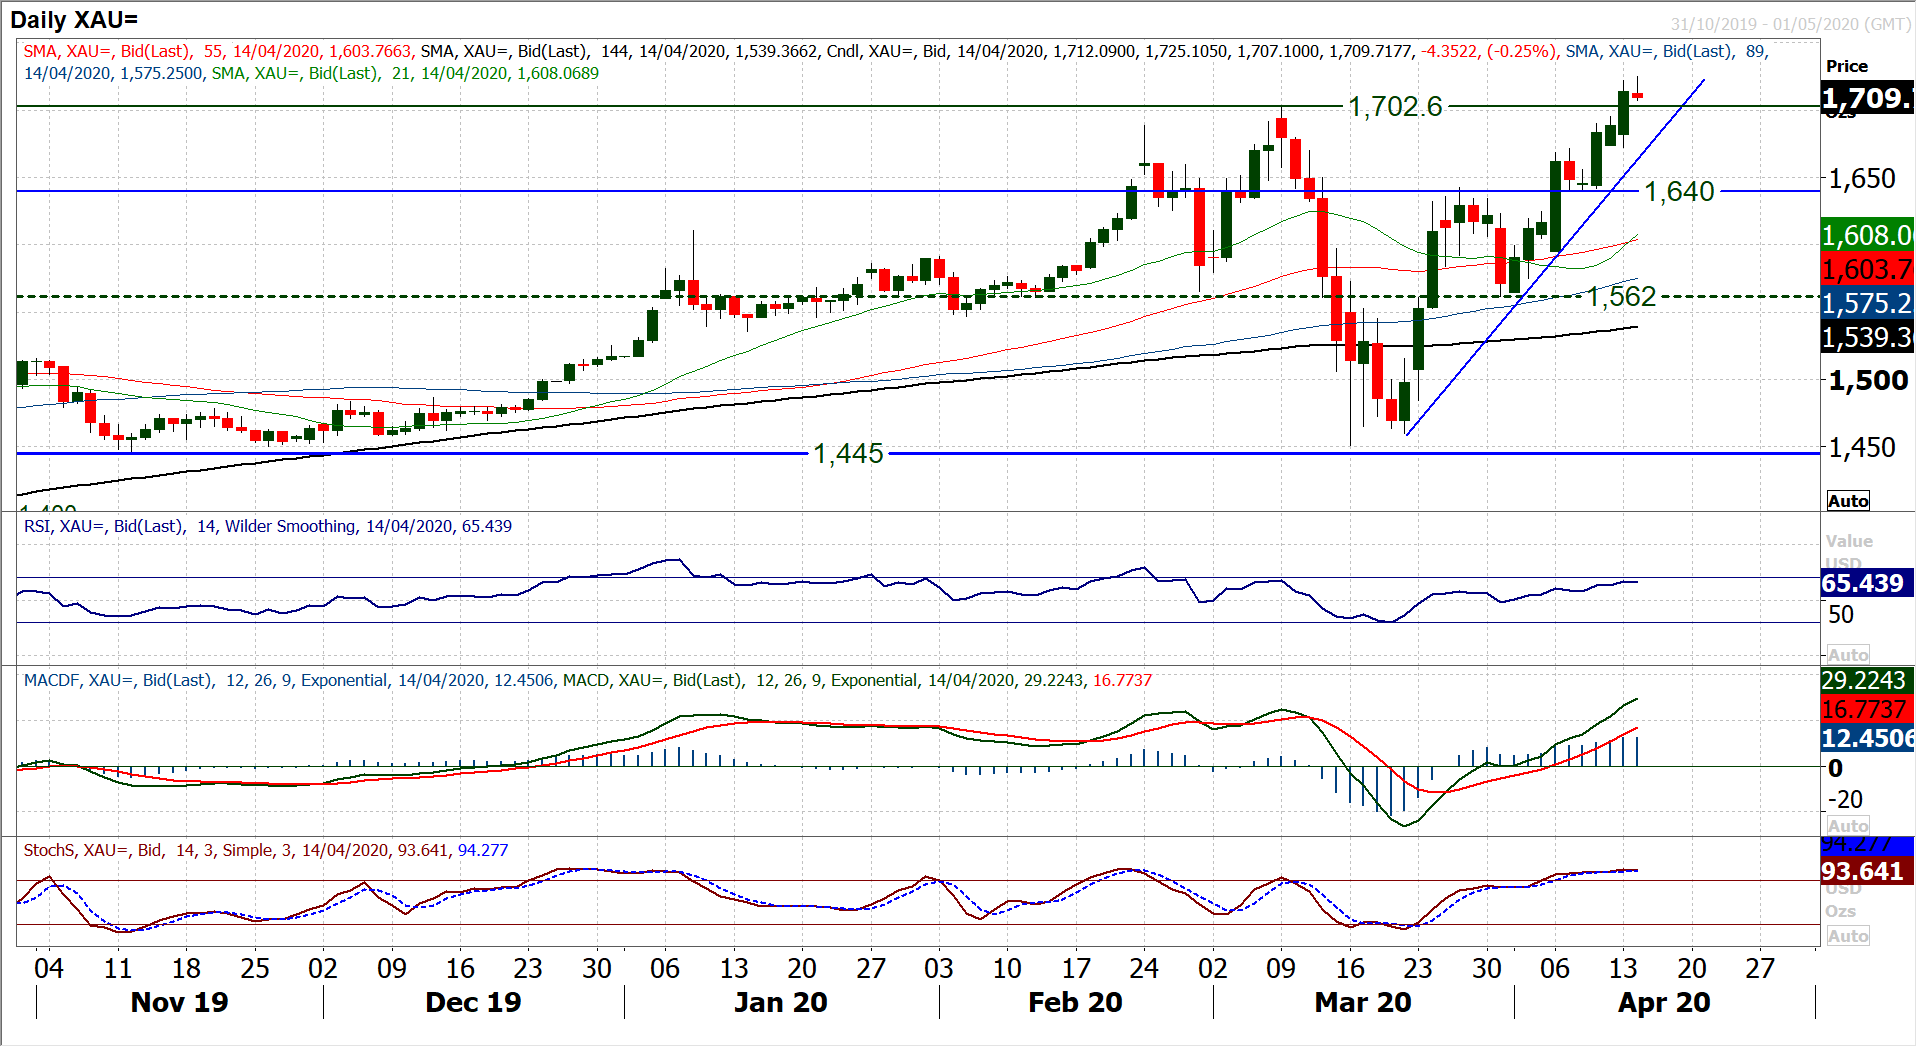
Gold has broken out to new multi-year highs once more. The peak in March was $1702 and this had been a high dating back to December 2012, but over the Easter weekend, the market has broken through to open the upside once more. The next minor resistance is $1754 whilst $1795 is the 2012 high and next barrier of note. The key for the bulls today is consolidation of the breakout. Coming over the Easter trading period with thin trading volumes, the move needs to be confirmed. Momentum is strong but certainly the bulls would be looking towards RSI pulling into bullish territory (above 70) to given them confidence. There are certainly questions of whether chasing a breakout at these levels is correct strategy. Previous breaks have seen unwinding retracements. Having already added $260 in four weeks, there has been a lot already put into the move. An uptrend sits at $1663 today, and there is good near term support around $1671/$1672. The early consolidation this morning shows a market cautious on this breakout and so are we. We remain bullish on the medium term outlook and prefer to buy into supported weakness now. Initial resistance is this morning’s high of $1725.
WTI Oil
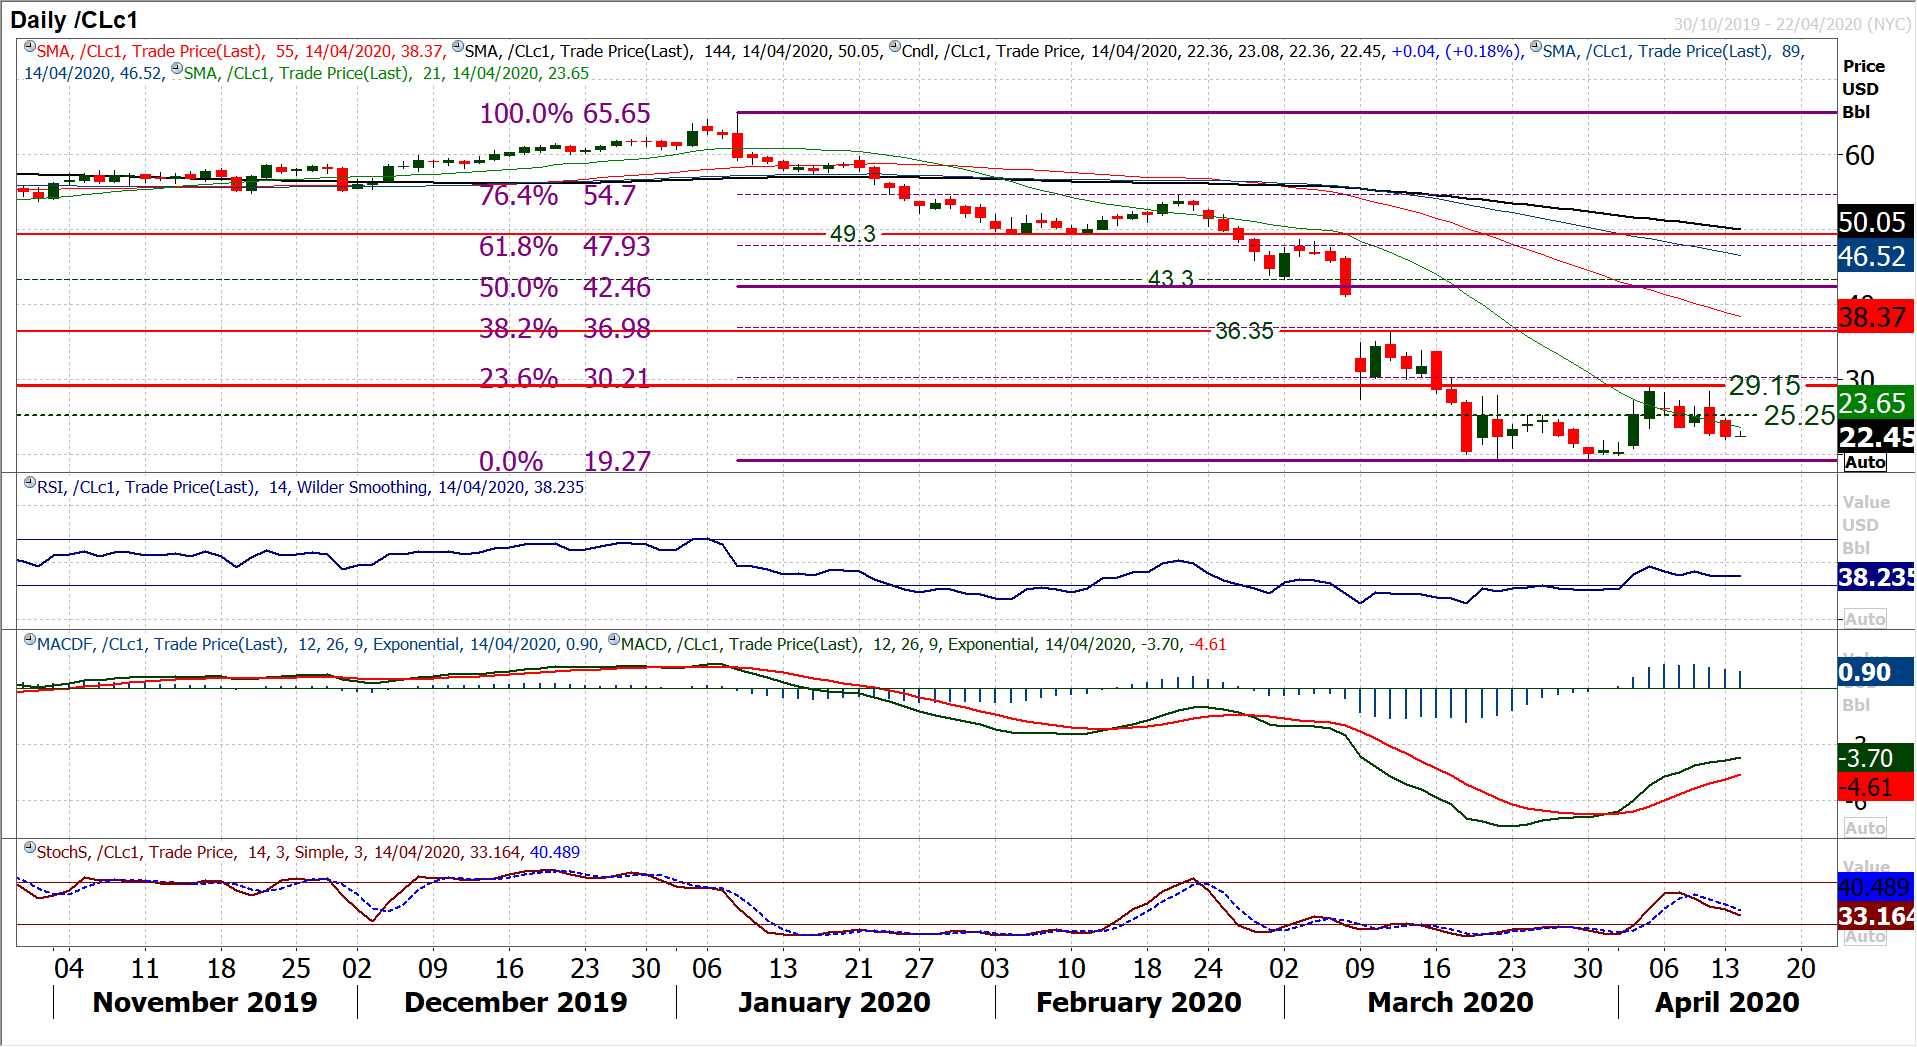
There has been a huge amount of drama and trading volatility on oil in recent sessions as the prospect of production cuts has been argued over by the major oil producers. As the dust settles on the agreed reductions, the market is still cautious. With three huge negative candles in the past four sessions, and a run of four lower closes in the past five, the trend is one of selling into intraday strength. However, the more optimistic traders will point to the fact that there has not been an instant bottom falling out of the market (the $19.27 key support remains intact) and there is a relatively stable market early today. How traders respond today could be crucial. The hourly chart shows hugely erratic moves, but how the market responds to resistance between $23.50/$25.25 (effectively still a mid-range pivot band) will give a strong indication of where the market is at. Failure to reclaim this pivot band will retain a corrective bias, and selling into strength for a drift towards $19.27. A close above $25.25 would change this.
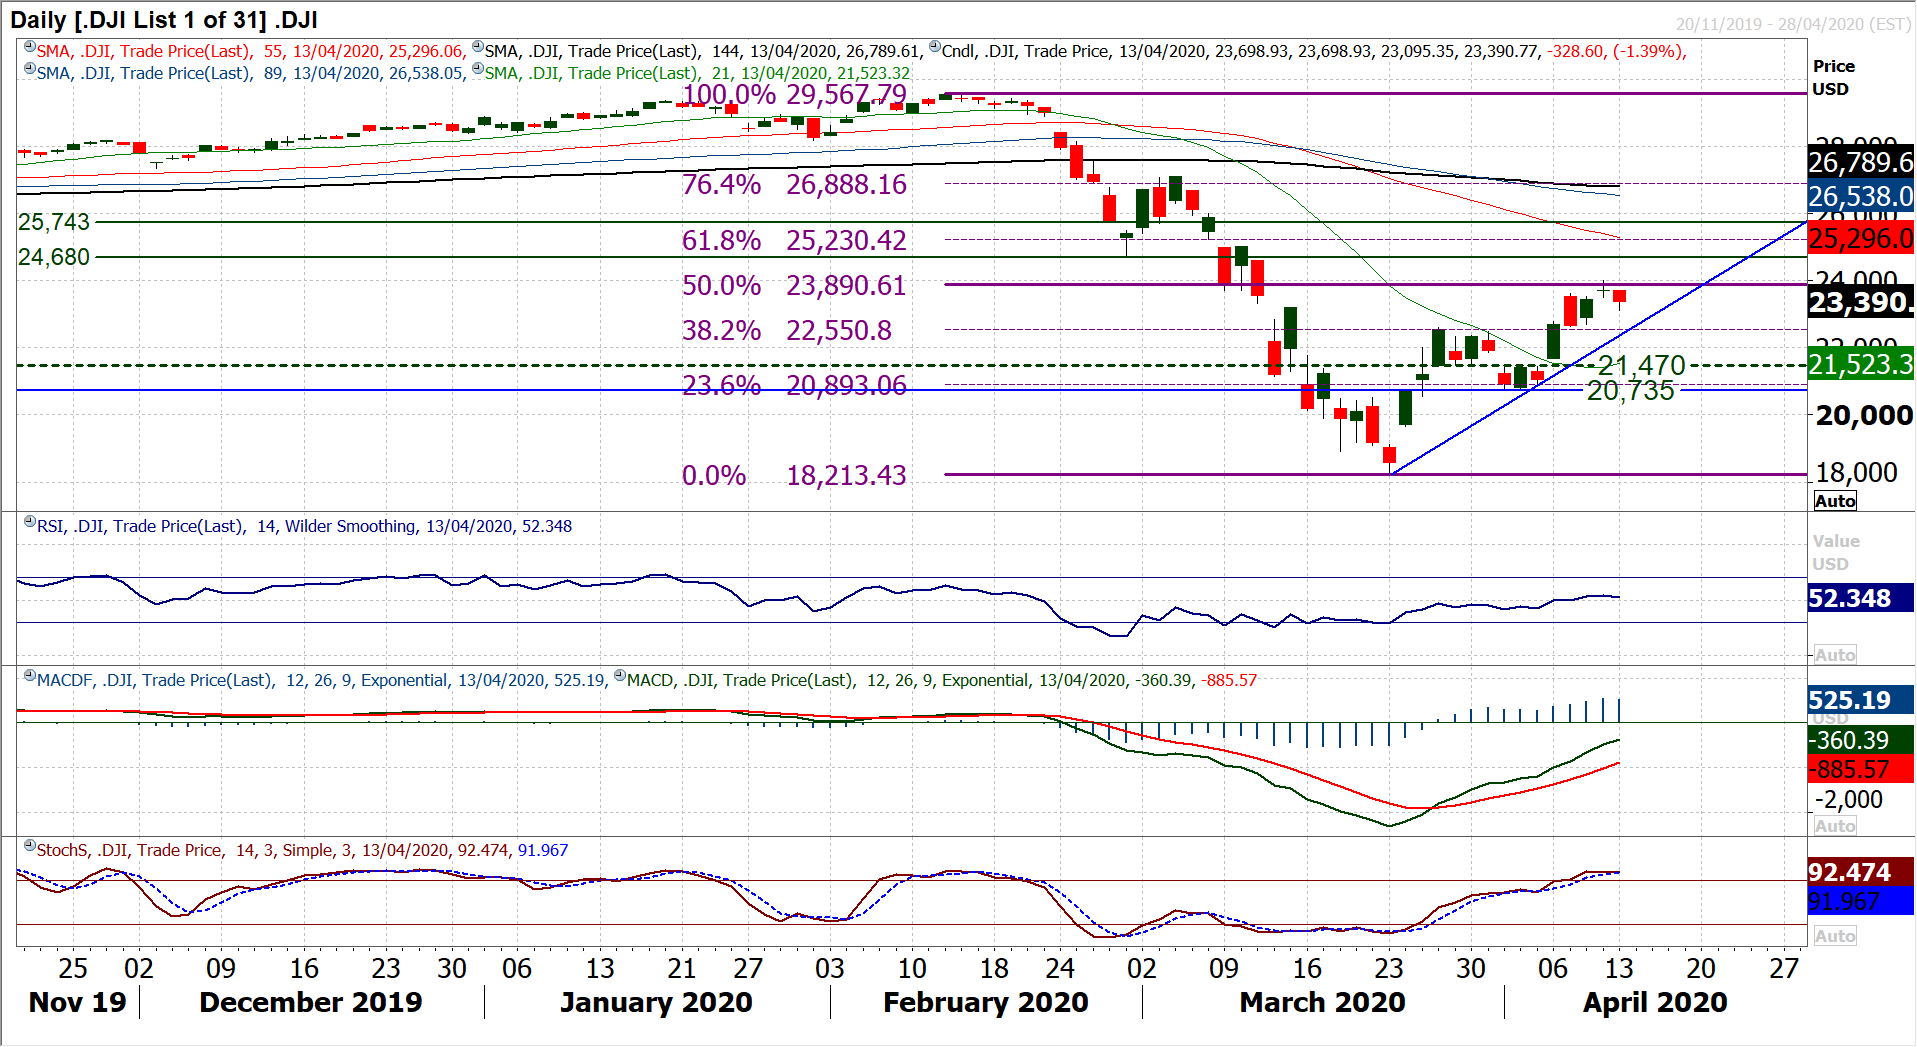
Dow Jones Industrial Average
On a session of slightly thin trading the Dow closed lower as the bulls just took their foot off the gas of the recovery. Thursday’s breakout came with a slightly cautious candle and this was reflected in yesterday’s session. However, given the strength and support of the key breakout above 22,595 the bulls are looking to continue the run higher. What is remarkable about this recovery is the reaction to the Fibonacci retracements of the 29,567/18,213 massive sell-off. They have been key turning points at every step of the recovery. The use of 23.6% Fib as support two weeks ago saw a rally through to 50% Fib (around 23,890) which formed the basis of resistance on Thursday. That after 38.2% (at 22,550) was the resistance for the first rebound high. With an uptrend of the recovery at 22,665 we look to use yesterday’s weakness as a springboard for the next run higher. We favour a continuation of this recovery, with a retest of 50% Fib and the resistance at 24,009before a continuation towards 61.8% Fib at 25,230. The importance of 38.2% Fib (given it is also the breakout) and the breakout band 22,480/22,595 is significant now.