Market Overview
Markets have been under the strain of uncertainty of how long the economic disruption will last from the Coronavirus. However, this morning we are seeing a positive reaction as some light has been seen at the end of the tunnel. Whilst it is still very early days, there are signs of a peaking of the rate of increase in the numbers of deaths in countries such as Italy, Spain and the UK. Markets rallied hard a couple of weeks ago on the huge monetary and fiscal response, however in the past week this rally has been ebbing away. Markets need to see a sustainable improvement in the virus numbers now if this positive reaction today is going to be more than just a blip. Treasury yields are higher, equity futures pointing to strong gains, whilst higher beta major commodity currencies (Aussie, Kiwi and Loonie) are performing well. The safe haven yen is the main underperformer whilst the dollar rally has stalled this morning. To add to the positive sentiment today is the apparent progress in the discussions between Saudi Arabia and Russia over oil production cuts. The oil price has rallied hard in the past couple of sessions. The news that a virtual meeting of OPEC+ penned for Monday had been pushed back to Thursday initially hit the oil price this morning, but the rumour mill is working from a positive perspective today and suggestion is that Saudi and Russia are “very close” to a deal. This is helping oil to regain earlier losses. However, we should expect further bumps in the road and newsflow/rumour to drive volatility in oil over the coming days ahead of Thursday’s meeting.

Wall Street closed lower on Friday with the S&P 500 -1.5% at 2488, but US futures are reacting strongly today, around +4.0% higher. This has helped Asian markets positive overnight with the Nikkei +4.2% although interestingly, the Shanghai Composite has lagged -0.6%. In Europe, a strong open is in prospect with FTSE futures +2.7% and DAX futures +4.0%. In forex, there is a risk positive bias, with JPY underperformance, AUD and NZD outperformance and USD mixed. In commodities, oil is around -1%/-2% into the European session but well off its lows which were over -10% at one stage. Gold and silver are around half a percent higher.
The second week of the month tends to be a little quieter for the economic calendar. There is not much on the docket today aside from a couple of entries in the European session. The UK Construction PMI at 0930BST is expected to decline to 44.0 in March (from 52.6 in February). The Eurozone Sentix Index for April at 1000BST is expected to decline to -30.0 which would be the lowest since August 2012 (from -17.1 in March).
Chart of the Day – AUD/USD
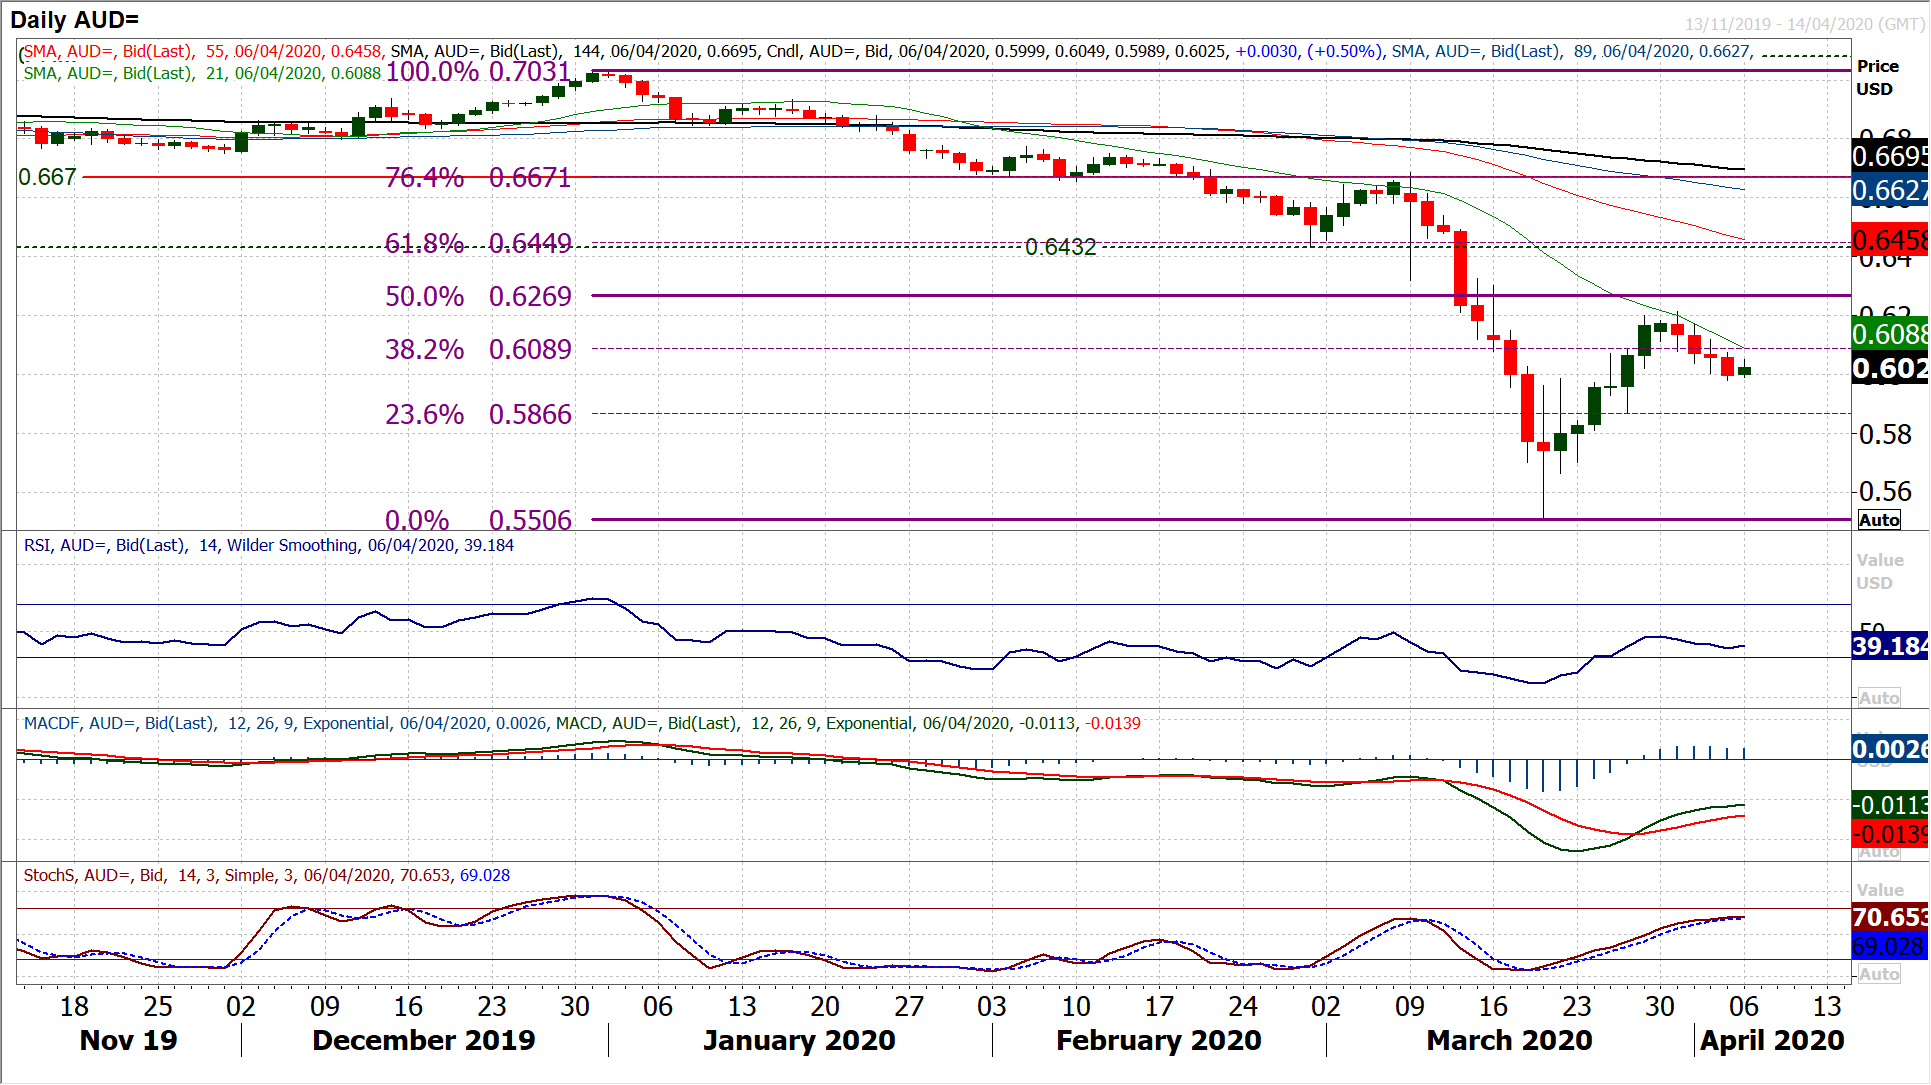
Risk sentiment has taken a turn for the worse in recent sessions and the question for traders on Monday morning is whether a mild improvement can be the turning of a corner. The strengthening of the dollar and retreat of the Aussie has reflected the worsening of sentiment. This has seen a new trend formation of lower highs and lower lows developing and a run of negative candlesticks. A mild tick back higher has done nothing to sustainable improve the picture and looks on the hourly char that unless the rebound gathers strength it will just be another chance to sell. Daily momentum indicators show the RSI falling over under the 50 mark and now below 40, whilst Stochastics are now on the brink of another bear cross (the last two bear crossed of February and March were excellent sell signals). The hourly chart shows a mini trend channel formation, with the hourly RSI failing consistently around 50 and going to 30 in classic bear market configuration. It suggests intraday rallies are a chance to sell. The hourly chart shows an old pivot at $0.6075 is resistance now, whilst the 23.6% Fibonacci retracement (of the $0.5505/$0.6213 rebound) is a basis of the next pivot resistance, along with the falling 55 hour moving average. A further retreat below $0.5985 opens the key near term higher low at $0.5870 but a deeper retracement is threatening now.
EUR/USD
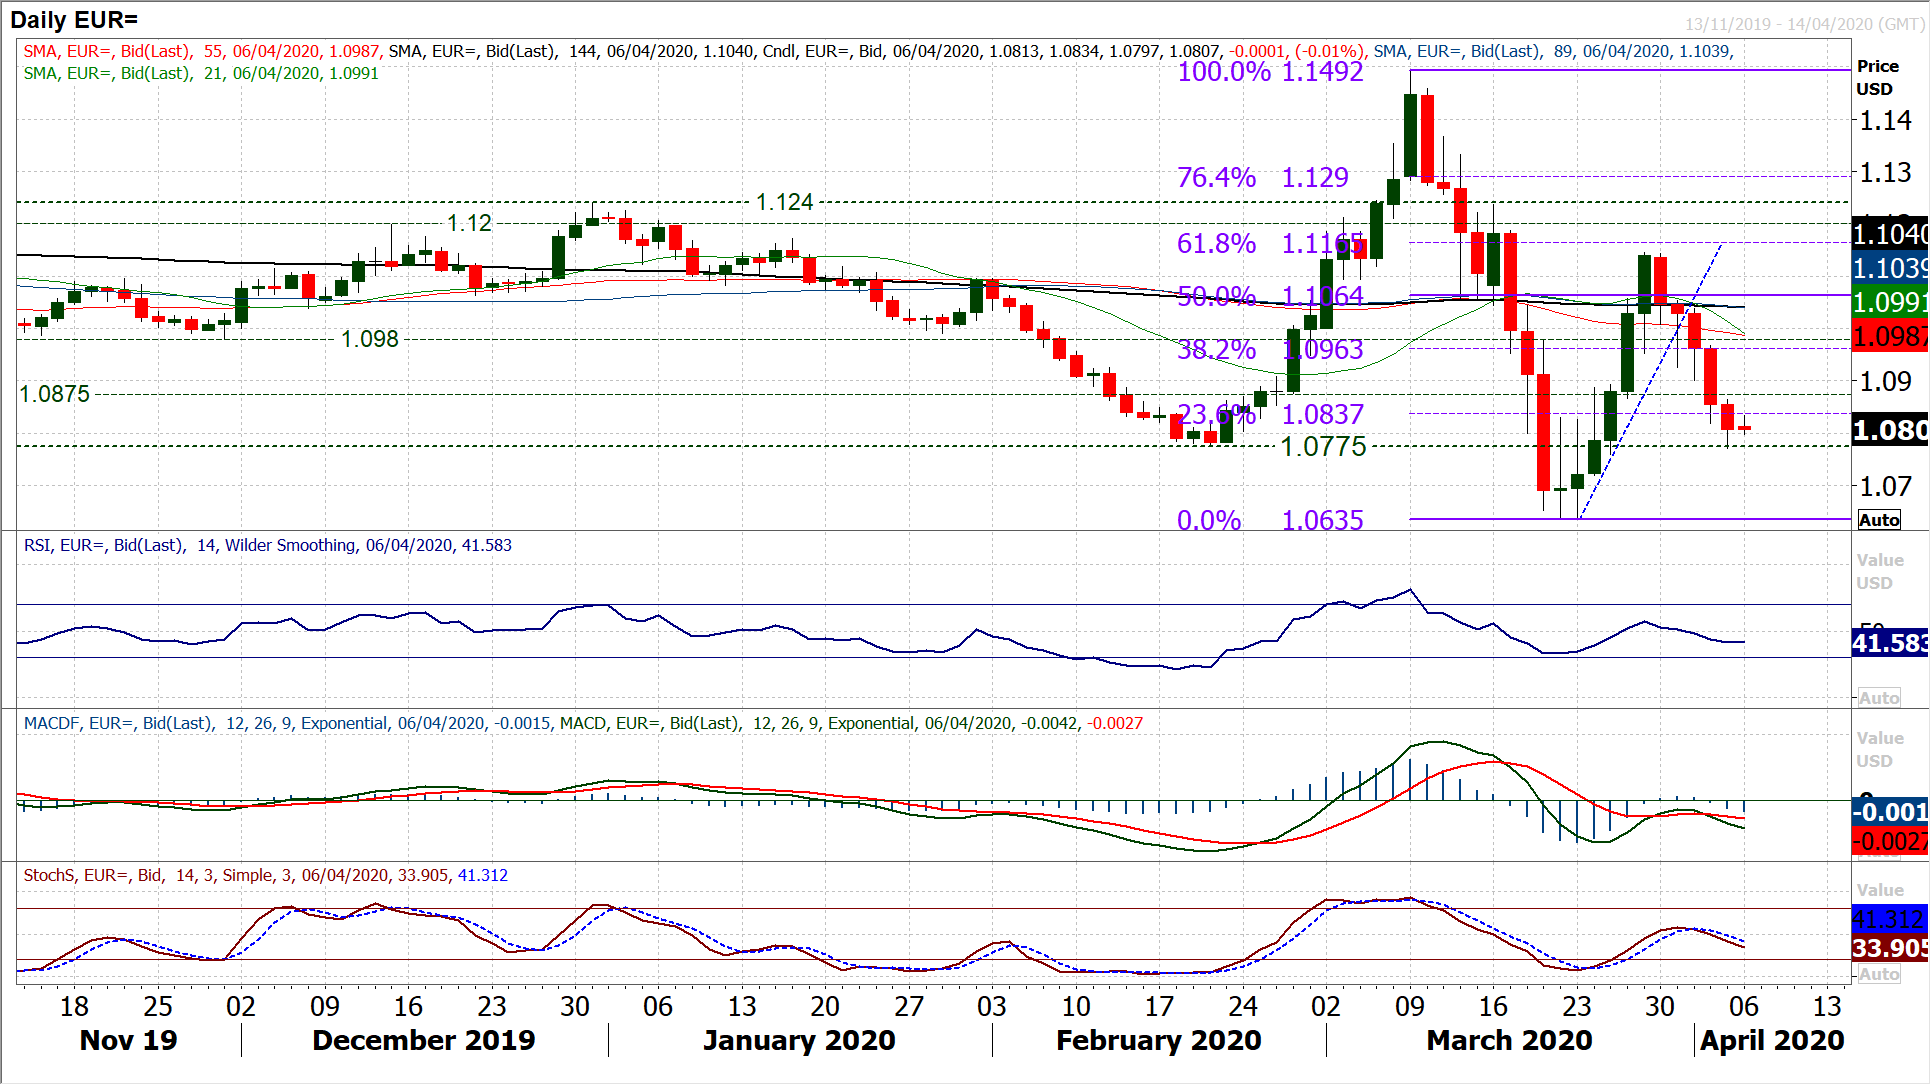
There has been a pause in the run of decisively negative candles this morning, as the euro has come into the new trading week with a degree of support. The question is, how sustainable is the prospect of recovery? There needs to be a move that breaks the run of lower highs, and for that, it needs a breach of $1.0865. Momentum maintains a negative bias on the daily chart, but there is a suggestion on the hourly chart that the bulls are testing the water. Hourly momentum is more positive this morning, but needs the RSI above 60 and MACD lines rising above neutral to suggest there is any real intent in this move today. There is an old pivot at $1.0830 which is being tested, but Friday’s reaction high at $1.0865 is important, whilst a move back above $1.0900 to confirm the bulls are fighting back. For now, in the absence of any sustainable recovery signals, this early bounce today is still most likely to be taken as a bear rally and another chance to sell. Support initially around $1.0800 this morning, with $1.0770 from Friday’s low being breached would simply re-open $1.0635 again. We favour selling into strength still at this stage.
GBP/USD
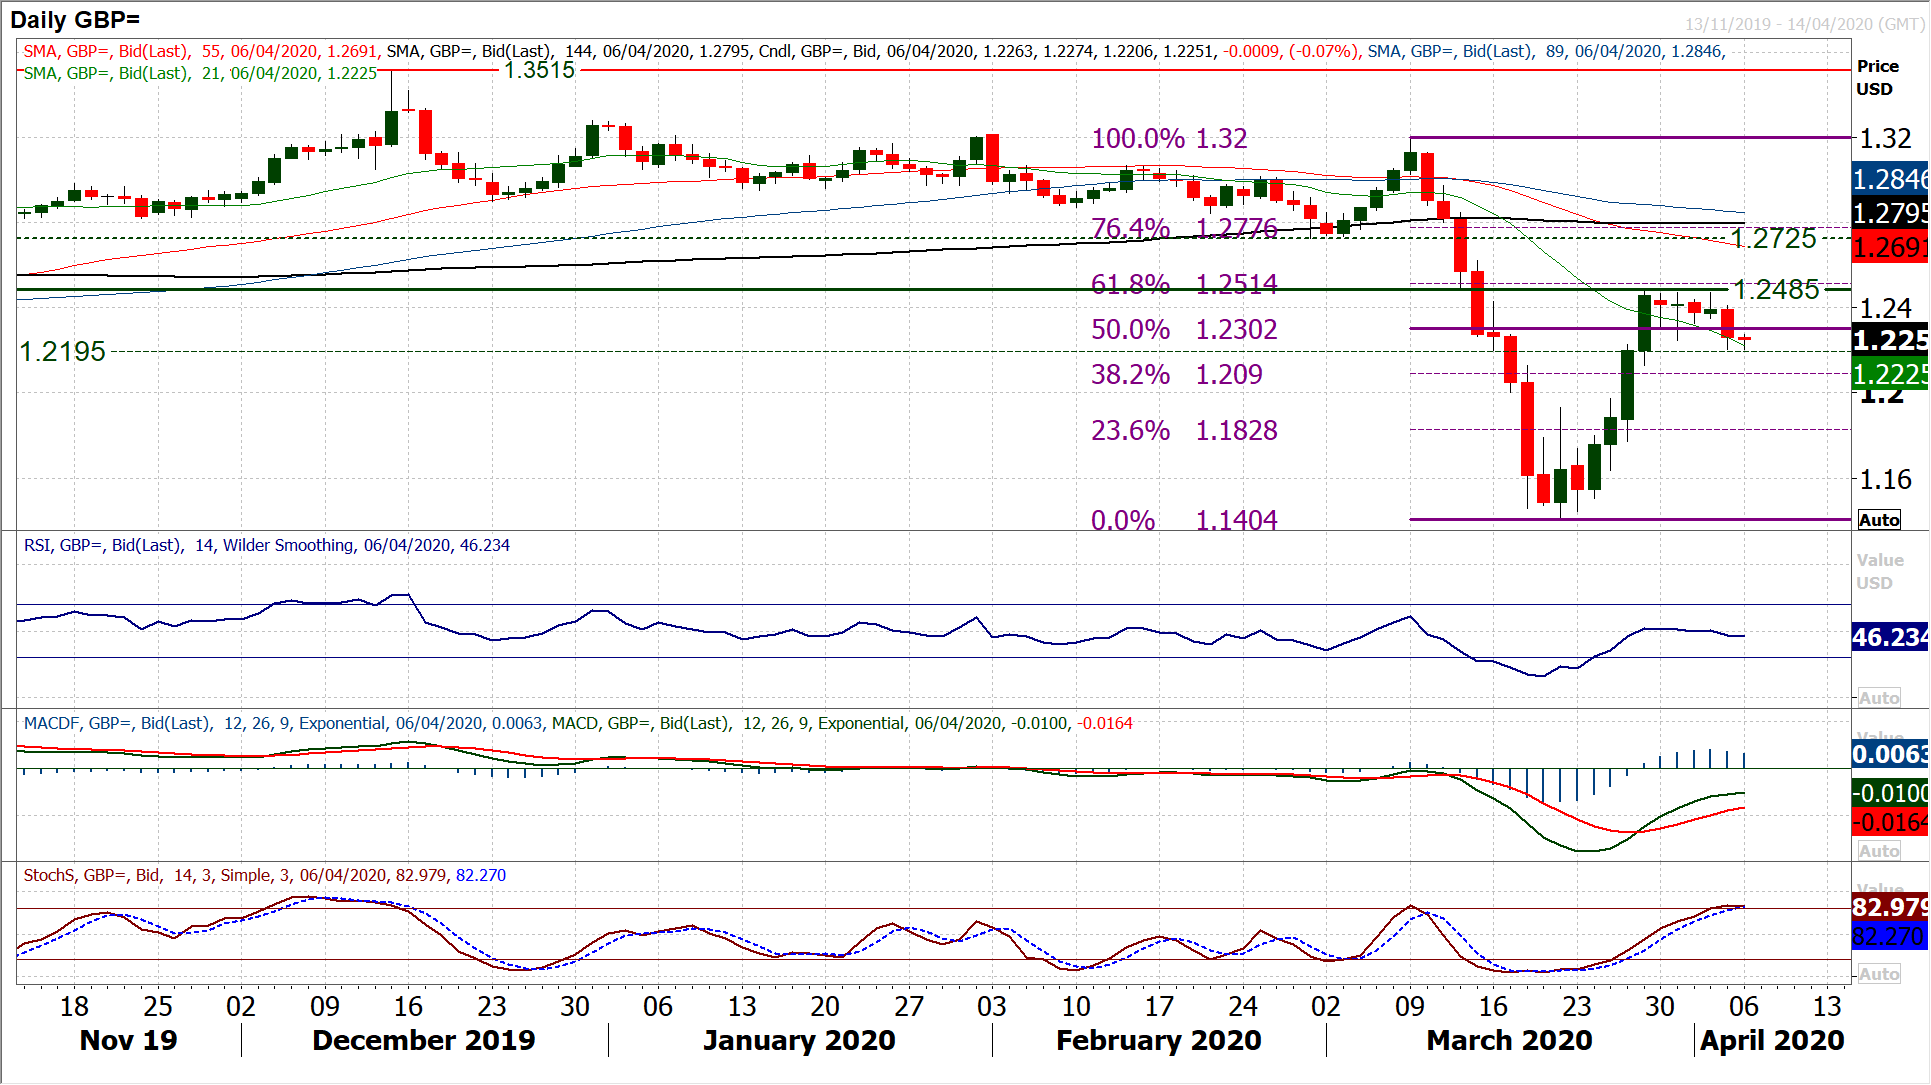
A bearish breakdown on Friday has ended thoughts of a consolidation on Cable and opens for a corrective move. A decisive closing break below $1.2300 not only took the market clear under the 50% Fibonacci retracement (of $1.3200/$1.1405) but also broke what had been a trading range formation (shown best on the hourly chart). Furthermore, the breach of the spike low at $1.2250 confirms that the bulls have lost control of Cable right now. Momentum is beginning to deteriorate, with RSI faltering under 50 and now means that the Stochastics are at risk of topping out too. The hourly chart shows that $1.3200 has become the basis of resistance since being broken, whilst momentum is increasingly corrective. A -185 implied downside target from a near term top pattern suggests $1.2120 (also a minor support area) is under pressure now. There is also little real support beyond there until the $1.1930/$1.2000 support. Near term rallies are increasingly struggling between $1.2250/$1.2300 and intraday rallies are seen as a chance to sell now for Cable as the outlook turns corrective.
USD/JPY
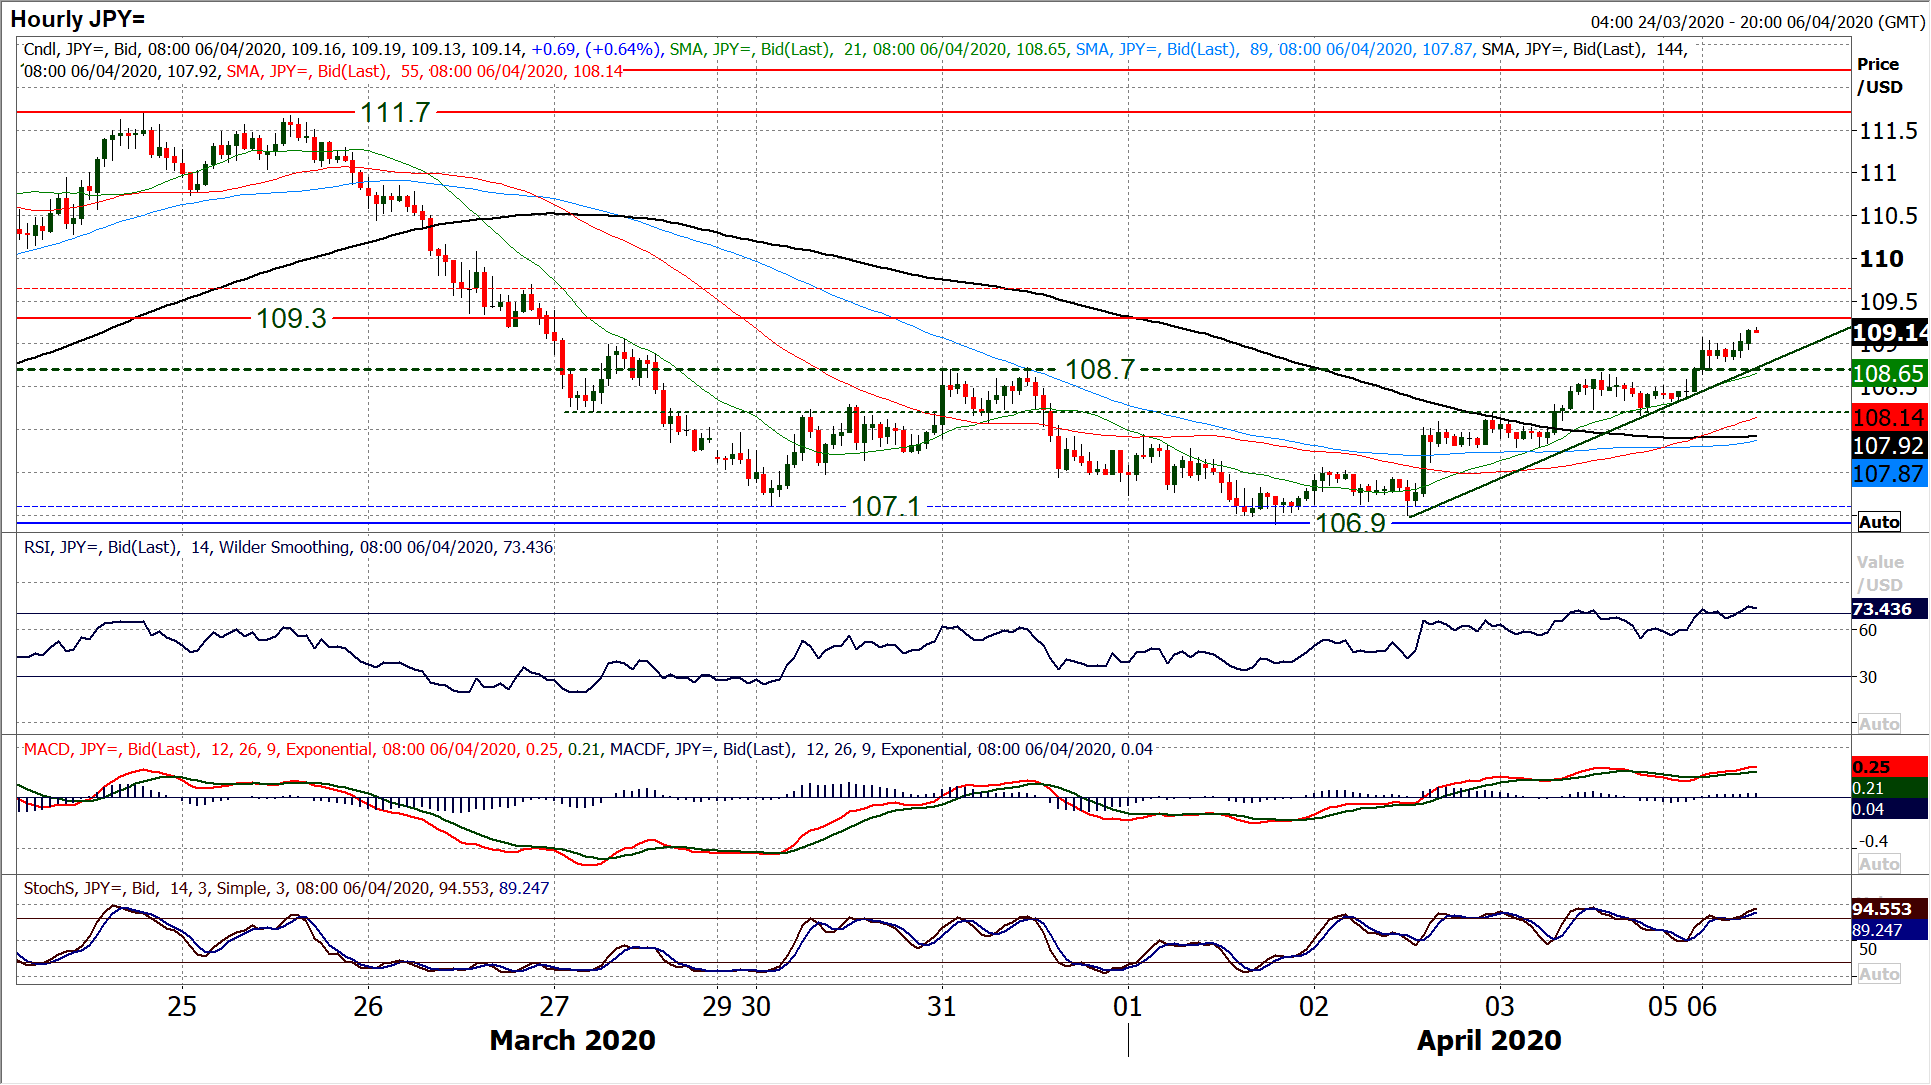
There has been a strengthening of the dollar in recent sessions. It is interesting that as risk appetite has fluctuated, there seems to be a move out of the yen (deemed often to be the safest of safe havens) and into the dollar. This has pulled USD/JPY higher in the past couple of sessions to break a corrective move, and the improvement has taken another step forward again today. A third straight positive candle has pulled the market clear above 108.70 resistance which is an important near term move. This shows on the hourly chart as a base pattern (implying c. +160 pips towards 110.30) and with momentum indicators taking on a far more positive configuration, there has certainly been a shift in outlook in the past session or so. Suddenly intraday weakness is being brought into, with mini breakouts becoming supportive. There is a basis of support now 108.20/108.70 and anything around 50/60 on hourly RSI is seen as a buying opportunity. There is a battle ahead though which will define how far this rally can go, and that is an old basis of resistance 109.30/109.70 set to be tested. The 76.4% Fibonacci retracement (of 112.20/101.20) is at 109.60 too. With moving averages flat and uncertain, this could turn into a choppy range play now, lacking trend or conviction. For that reason, we are cautious.
Gold
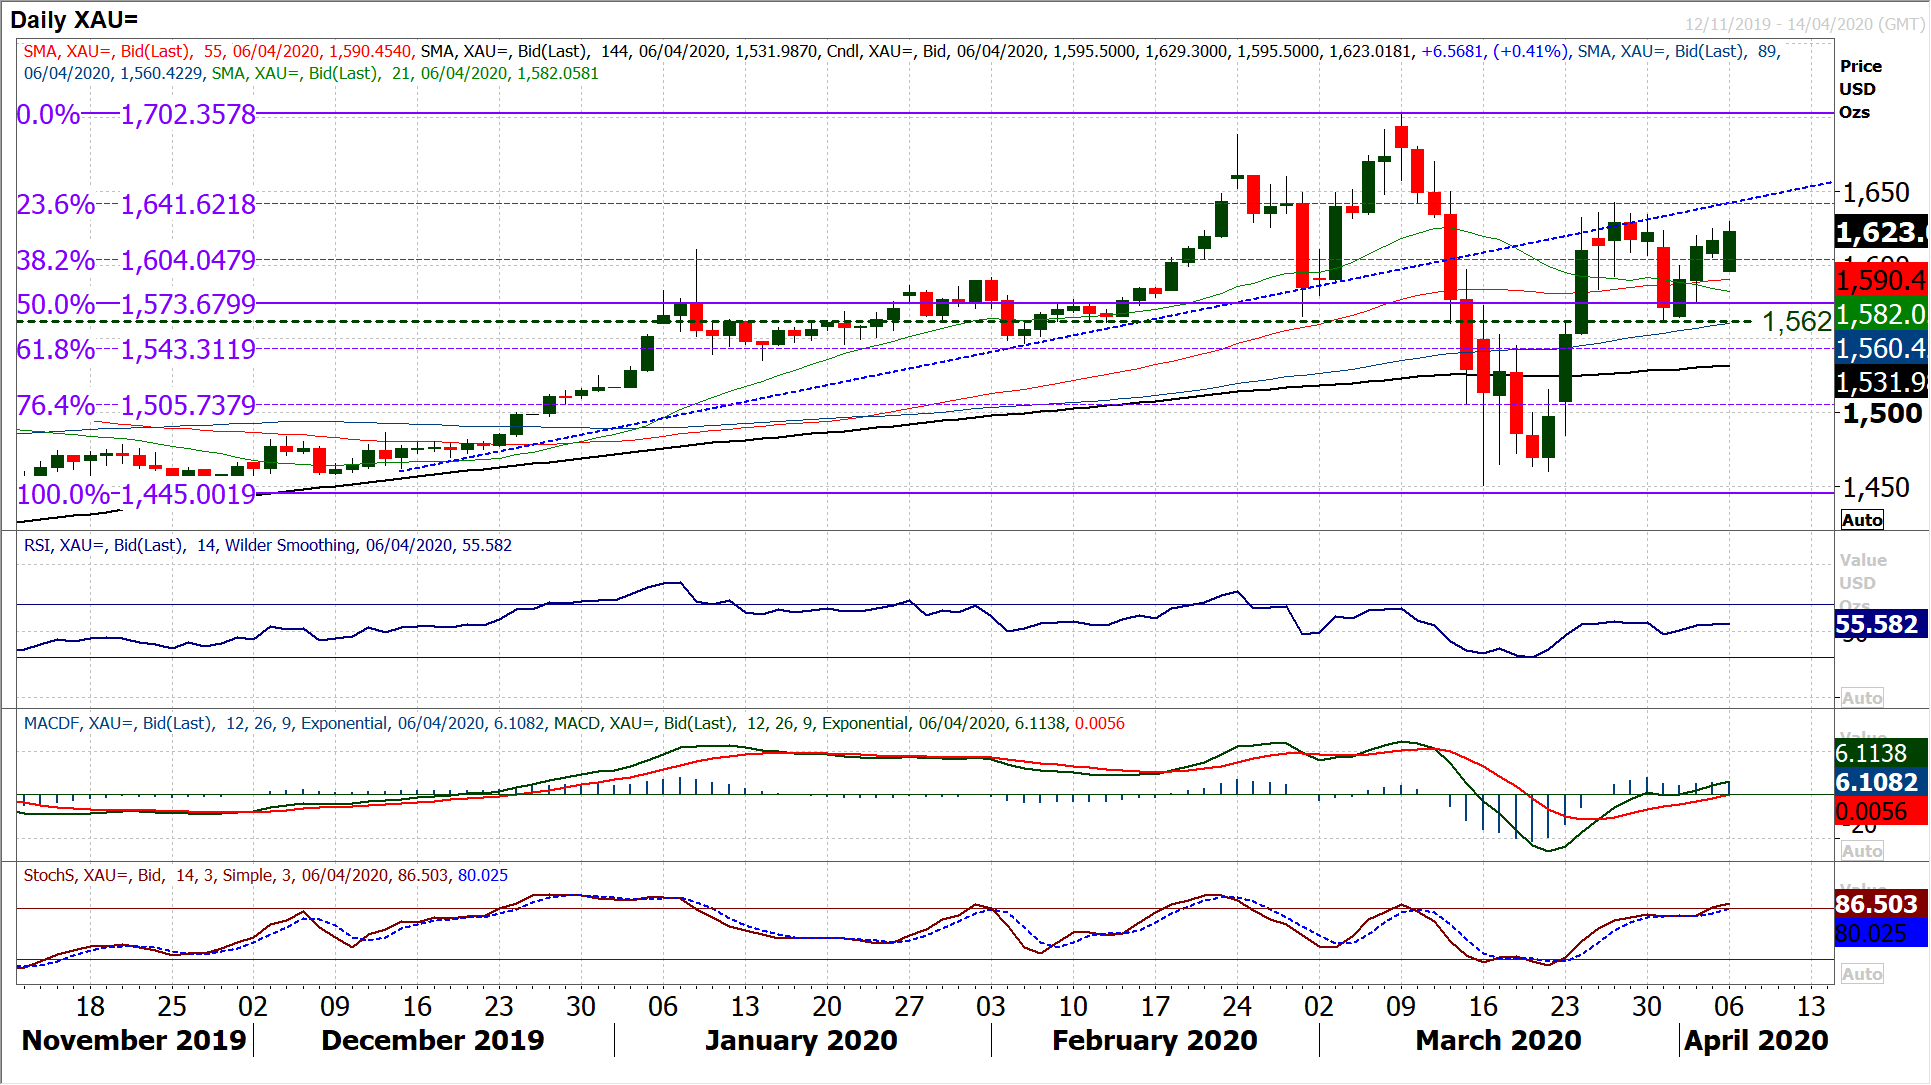
Despite the dollar strengthening on Friday, gold held up relatively very well. This bodes well for the near term outlook which has improved in recent sessions and has now posted three consecutive positive candles. Trading above the 38.2% Fibonacci retracement (of $1445/$1702) at $1604 is a gauge that suggests there is a bias towards the 23.6% Fib (around $1642). Despite an early gap lower at the open on Monday, the bulls once more seem happy to support and are pulling gold higher again. Already testing Friday’s high of $1625 is a strong response and closing today above here would show the bulls are ready to push forward again for the 23.6% Fib and test the March high of $1642. Momentum indicators are now picking up positively, with the Stochastics pulling into strong bull configuration, MACD lines moving above neutral and RSI back above 50. There is a good support band now growing around $1595/$1605 early this week as a platform for further recovery gains. Given the positive reaction to the correction to $1562 (an old pivot) the bulls are well-positioned once more. We still see weakness as a chance to buy, but now favour pressure on $1642 and an eventual breakout towards $1702. We remain positive whilst trading above $1562 persists.
WTI Oil
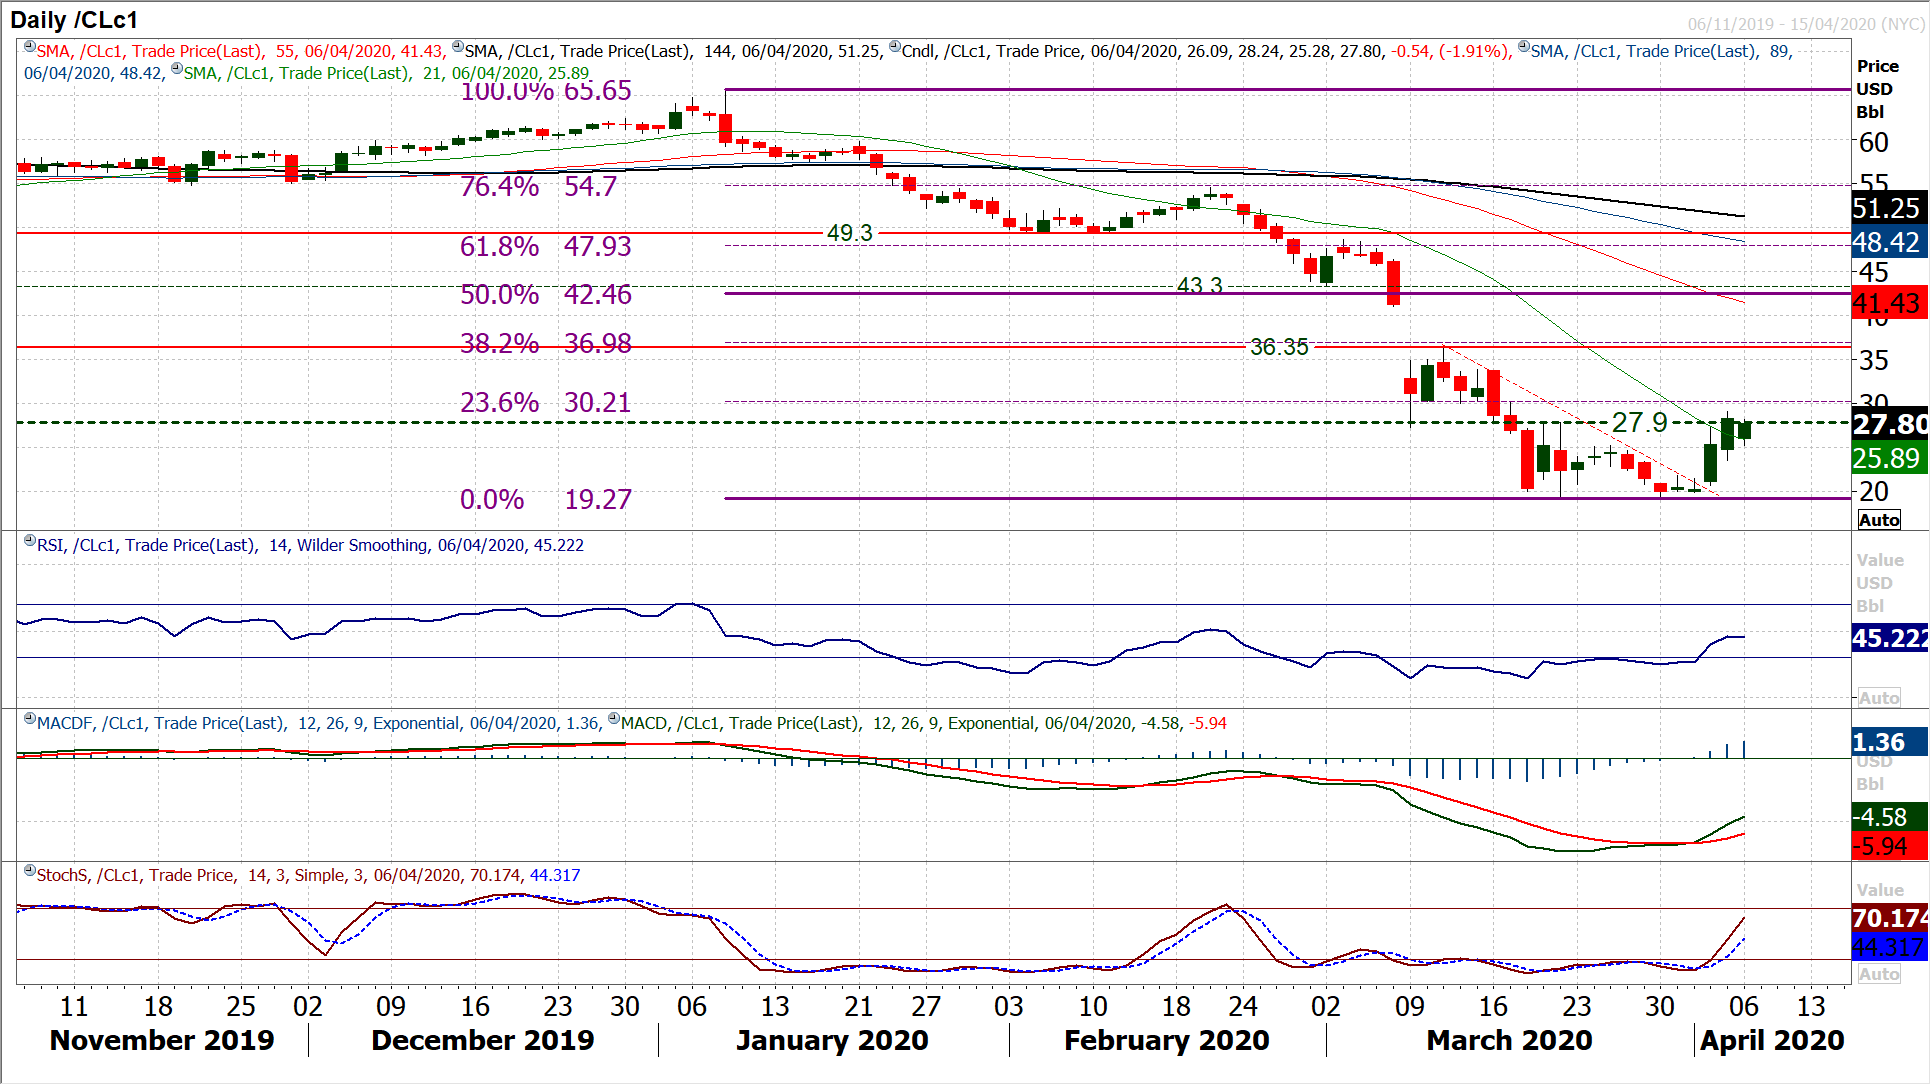
Oil is predominantly a news driven market in the near term as traders respond positively to the suggestion that Russia and Saudi Arabia are preparing for an agreement over production cuts. The sharp bull candle of Thursday was backed by another positive and strong move higher on Friday, meaning two very strong candles have changed the outlook. On a technical basis, a closing breakout above $27.90 is a base pattern, but given the volatility in the market still, waiting for confirmation of a second close above $27.90 may be wise. This is especially the case given the huge early gap lower at the open today. Although the market has since recovered, it shows that the headlines are still a key factor. Looking at the daily chart, there are strong positive recovery signals coming through on momentum, with bull crossed on MACD and Stochastics, whilst RSI is above 40. There is initial good support now at $23.35/$23.70 and following this morning’s dip, a higher low at $25.40. Market sentiment has seeming now turned a corner and we look to use weakness into support as a chance to buy. This is clearly still a very volatile market, but there is the serious prospect of recovery now. A confirmed two day close above $27.90 would complete a big base pattern and imply $36.50 in due course. The next real resistance is not until $33.85.
Dow Jones Industrial Average
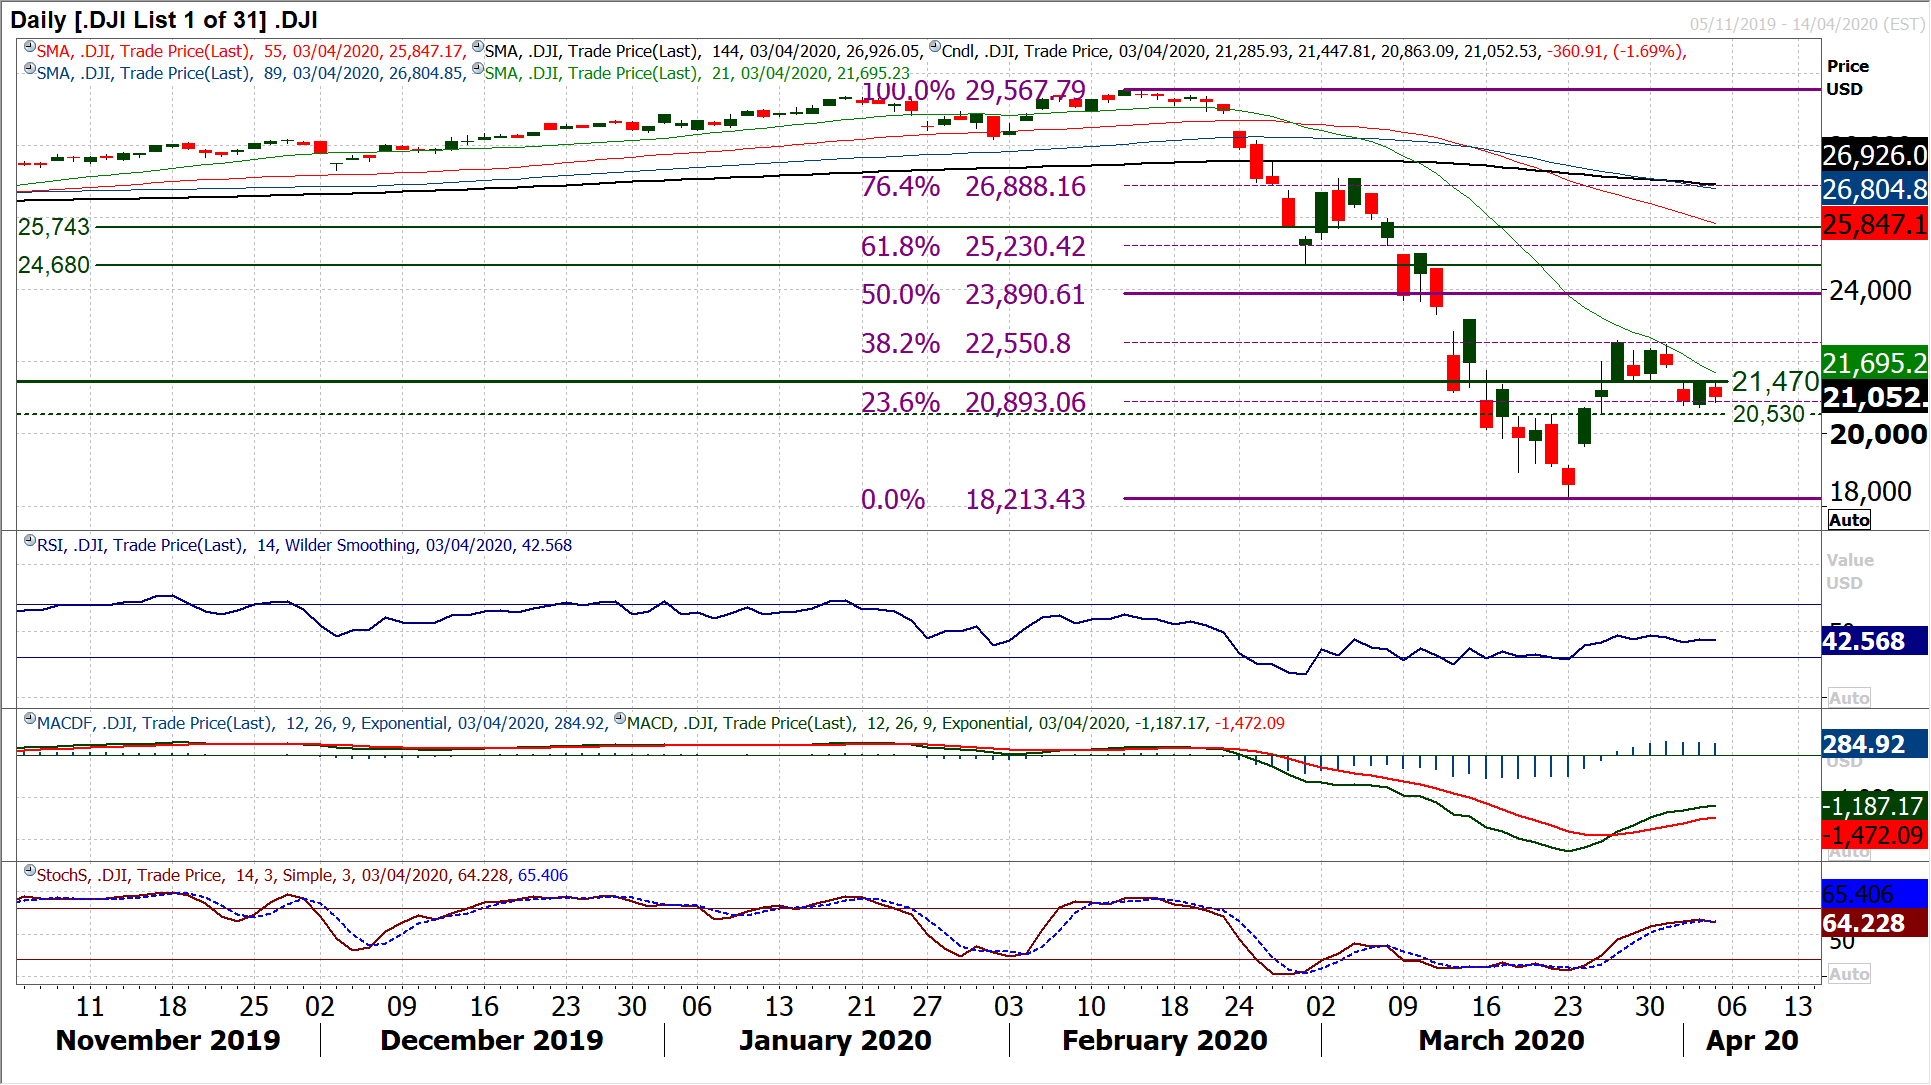
The near term outlook on the Dow is still a very uncertain. Volatility remains elevated (albeit less than a week ago, with the Average True Range falling fast now but still at around 1250 ticks). This comes as the impetus of a recovery has drained away in the past week or so as the rally has turned back from 22,595 but latterly has found a pivot resistance around 21,470. The near term outlook will be defined by this pivot now, as it has turned from a basis of support into a basis of resistance in the past few sessions. Futures early today would suggest that this pivot will be broken back to the upside, and if so, the bulls need to hang on to this move and make the pivot into an area of support once more. This is an important moment with momentum indicators beginning to roll over too. The bulls need to move to prevent a series of sell signals from posting on Stochastics and RSI. Support at 20.735 (Thursday’s low) is growing now, a level around the 23.6% Fibonacci retracement (of 29,567/18,213) around 20,890.
