Market Overview
There is more of a positive feel to markets forming once more. The question is whether this can be sustainable. Initial signs of the Coronavirus being contained have been seen. Although the death toll has now surpassed the 1000 mark, the number of new cases of the virus is starting to fall. This is allowing some of the markets which are closely aligned to Chinese growth to benefit. The Chinese yuan trading below 7.00 against the dollar is seen as a barometer, whilst the Australian dollar is also ticking higher for a second successive day. The oil price is also picking up this morning and at least looks to be building stability now. Safe haven assets are losing some attraction here, with the US 10 year yield +3bps initially, whilst the yen is slipping back along with gold lower. Wall Street closed higher once more, with the S&P 500 juggernaut posting further all-time highs. There will be a keen focus today on how Fed chair Jerome Powell sets his stall out in front of Congress today. With the impact of the Coronavirus on the US consumer still to be ascertained, he is likely to try and play a straight bat to scrutiny.

Wall Street closed strongly, with the S&P 500 +0.7% at 3352, whilst US futures are another +0.3% higher early today. A broad positive session across Asia, although Japan was on a national holiday today. The Shanghai Composite was +0.4%. This has translated well to the European session, with FTSE futures +0.6% and DAX futures +0.8%. In forex, the main theme is risk positive, with JPY underperformance, whilst AUD is stronger along with NZD and CAD. In commodities, gold is slipping back by -$3, whilst oil has found some support today, currently just under +1% higher.
UK growth is in focus on the economic calendar today, with a first look at Q4 and also just as important, how the UK ended 2019 on a monthly basis. UK GDP (Q4 prelim) is at 0930GMT and is expected to show growth flatline over the three months (+0.4% in Q3) which would leave the annual growth at +0.8% for 2019. Keep an eye on December monthly growth which is expected to pick up by +0.2% (after a decline of -0.3% in November). UK Industrial Production is also at 0930GMT and is expected to improve by +0.3% in the month of December (after a fall of -1.2% in November) which would improve the year on year decline to -0.8% (from -1.6% in November). Finally, the UK Trade Balance is also announced and is expected to show the deficit widening to -£10.0bn in December (back from -£5.25bn in November). The US JOLTS jobs openings for December are at 1500GMT and are expected to improve slightly to 7.00m (from 6.80m in November).
Aside from the data, today is awash with central bankers. The big focus will be on Fed chair Powell’s Congressional testimony to the House Financial Services Committee at 1500GMT. This bi-annual event could help to forge the outlook for later into 2020 where potential cuts begin to be priced. Just before Powell, the ECB President Christine Lagarde gives a speech to the European Parliament, although given how tepid the last ECB meeting press conference was, she is unlikely to rock the boat too much. Then there is also the Bank of England Governor Mark Carney who is testifying to the Lords Economic Affairs Committee in one of his final official engagements before stepping down on 15th March. Beyond all that there are a couple of other Fed speakers too. Randall Quarles (board member voter, centrist) is speaking at 1715GMT, whilst Neel Kashkari (regional voter, big dove) is speaking at 1915GMT.
Chart of the Day – EUR/JPY
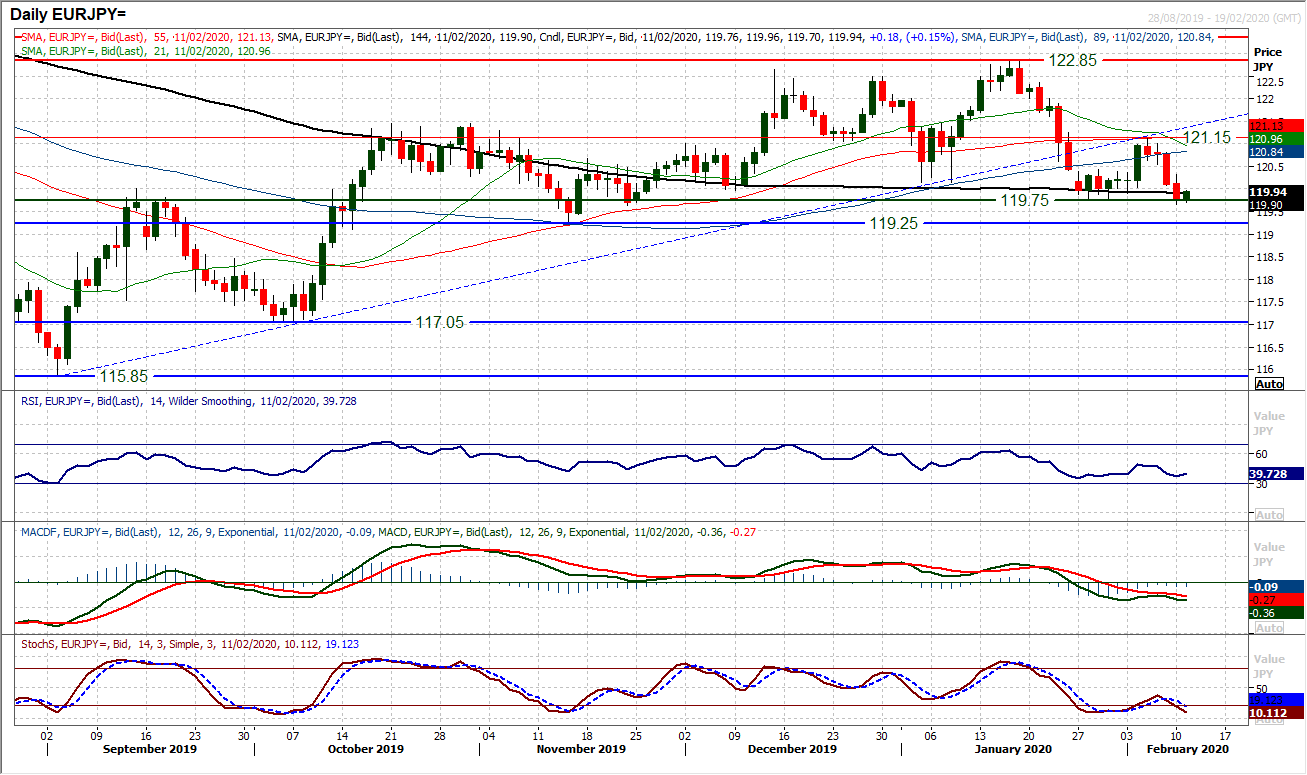
The outlook on Euro/Yen has been deteriorating once more as the euro has comes back under pressure across the forex majors space. This means that the key medium term support around 119.75 is once more being tested. Yesterday’s session saw a slight intraday breach only to close almost bang on the support. However, the concern that the bulls have, is that having failed at 121.15 (under the resistance of the old 5 month uptrend and another old pivot) the configuration on momentum indicators is also increasingly turning corrective. The RSI recently turned back from 50 and is struggling below 40, whilst a bear cross on Stochastics and what looks to be a potential “bear kiss” on MACD lines all suggest that near term strength is a chance to sell. Although the market has ticked higher early today, there is plenty of overhead supply 120.00/120.40 to restrict a recovery. A decisive closing breach of 119.25 is a sign of continued downside to initially 119.25 but also effectively confirms a six week top pattern to imply a downside target towards 117.65. The hourly chart shows further resistance 120.40/124.60.
EUR/USD
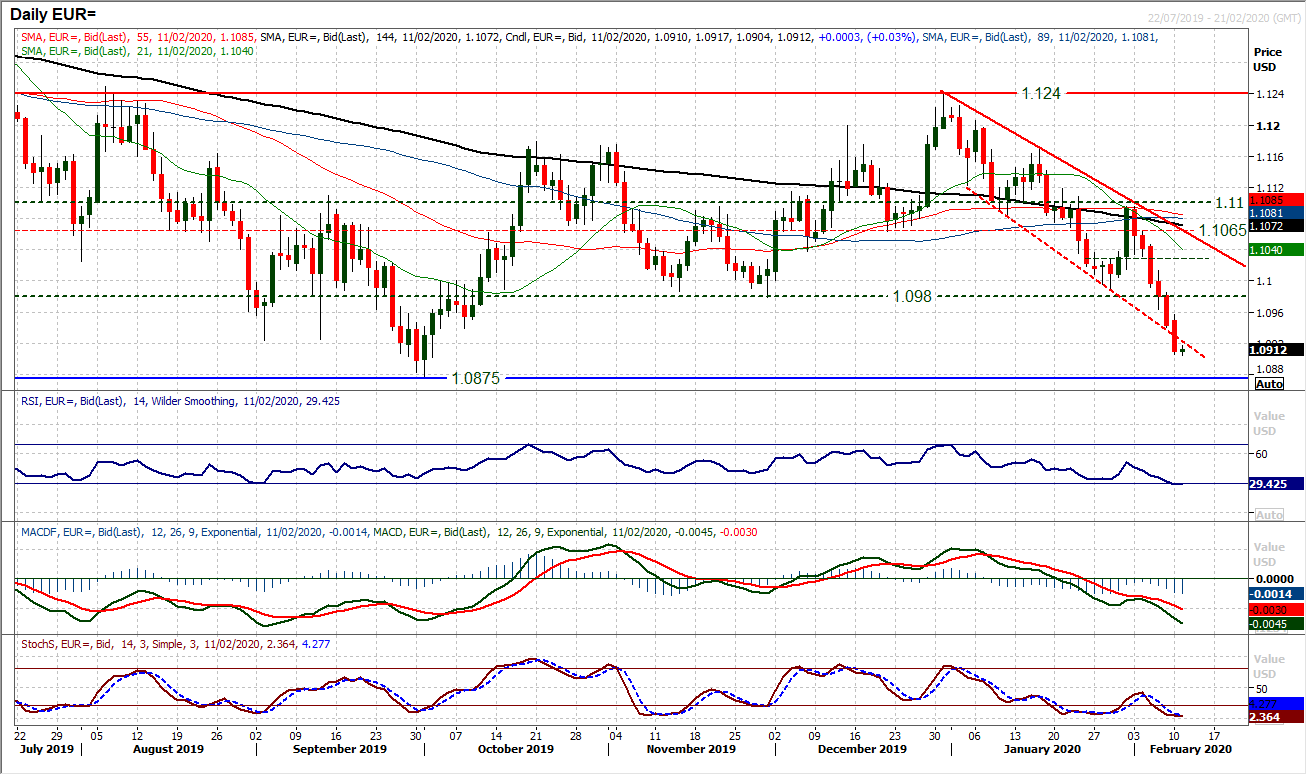
The euro continues to tumble. We discussed yesterday the prospect of selling into strength, but even near term rallies do not seem to be able to last the distance. Another decisive bear candle has taken EUR/USD through the bottom of the downtrend channel and is now setting up a test of the crucial support at $1.0875. That is the October low which is a low dating back to May 2017, so clearly comes with some significance. The concern is that right now, the euro is just not stopping, with momentum indicators accelerating deeper into bearish configuration. The one point of note though which contrarians may consider, is that the RSI is around 29, the lowest since August 2018. A market with the liquidity of EUR/USD rarely gets to this level on the RSI and so a technical rally is becoming an increasing likelihood. A basic RSI cross back above 30 has historically been a signal. For now, there is absolutely no suggestion of any sustainable positive reaction on the hourly chart. Watch for the hourly RSI pulling above 50 and hourly MACD lines above neutral. Resistance at $1.0940 and $1.0980.
GBP/USD
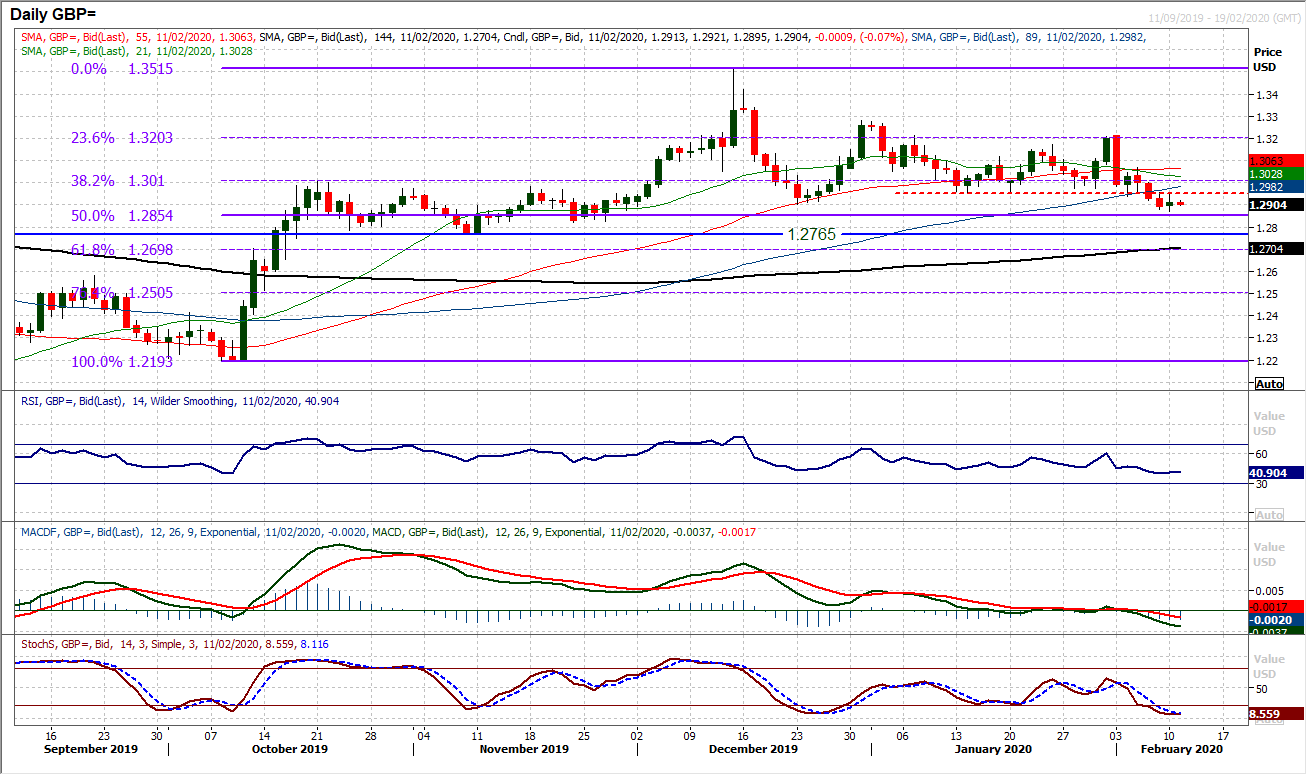
Cable has broken the support band $1.2900/$1.2950 and we have shifted our outlook from bullish to more neutral. However, we still do not see sustainable downside forming. We see a medium term range formation developing where sterling may not be able to move strongly higher, but also holds up relatively well. Yesterday’s session rebounded off $1.2870 and it is interesting to see that the momentum indicators are only mildly corrective (considering the broad dollar strength that has developed in recent weeks). The hourly chart shows an interesting positive divergence on the lower lows of recent sessions and the slightly higher lows of hourly RSI and MACD. Is this the early signs of a recovery? The resistance band of overhead supply between $1.2940/$1.2960 will be important in this. A decisive move above $1.2960 would be a near term reversal signal. Support is now at $1.2870.
USD/JPY
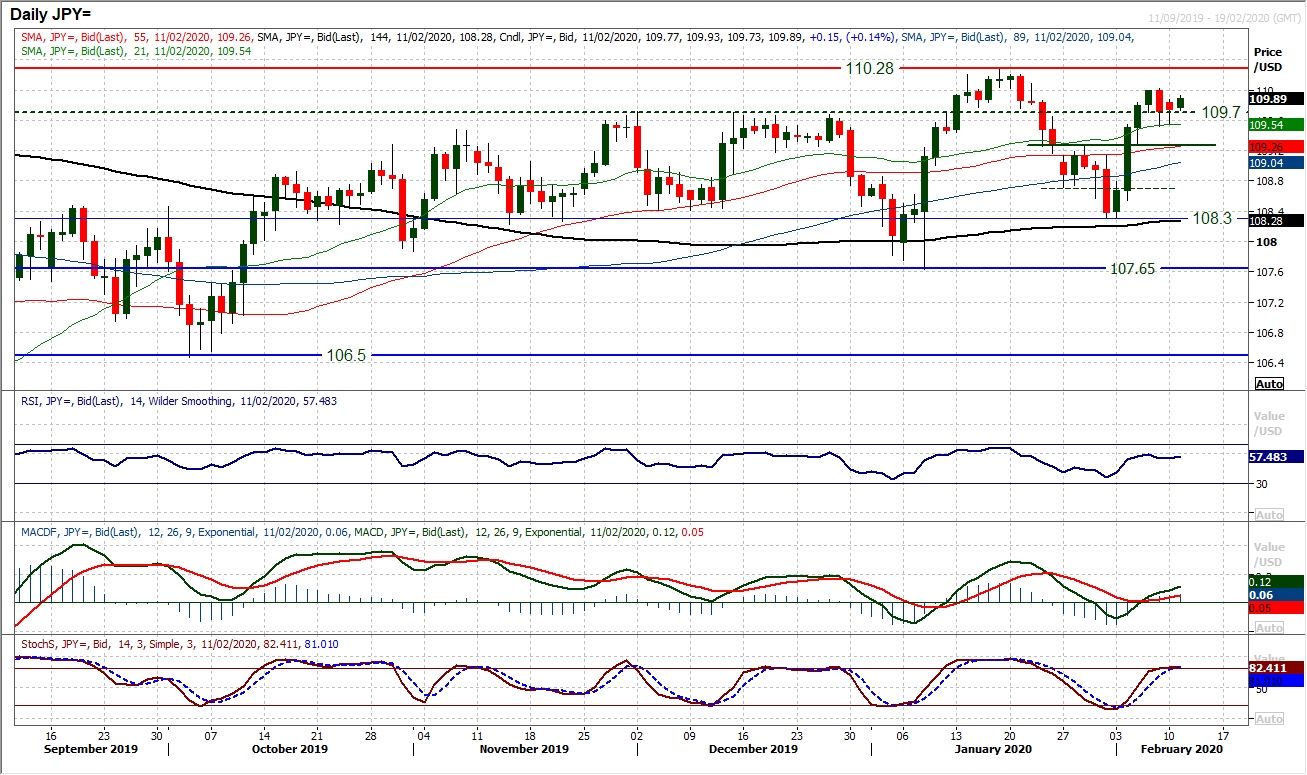
Although Dollar/Yen has lost the positive momentum in the past couple of sessions, the bulls still remain in control. Trading above a clutch of rising moving averages, with a positive bias to the momentum configuration, it suggests that near term weakness is still a chance to buy. Two consecutive mild negative candles hints at consolidation, but whilst the support of the near term pivot at 109.25 remains intact then the outlook is still positive. Initial support is at 109.50 from Friday’s low, but the hourly chart shows settled momentum and a sense that weakness is a chance to buy. With the market again looking to tick higher this morning, there is little to change our view that would suggest a retest of 110.30 January resistance will be seen in due course.
Gold
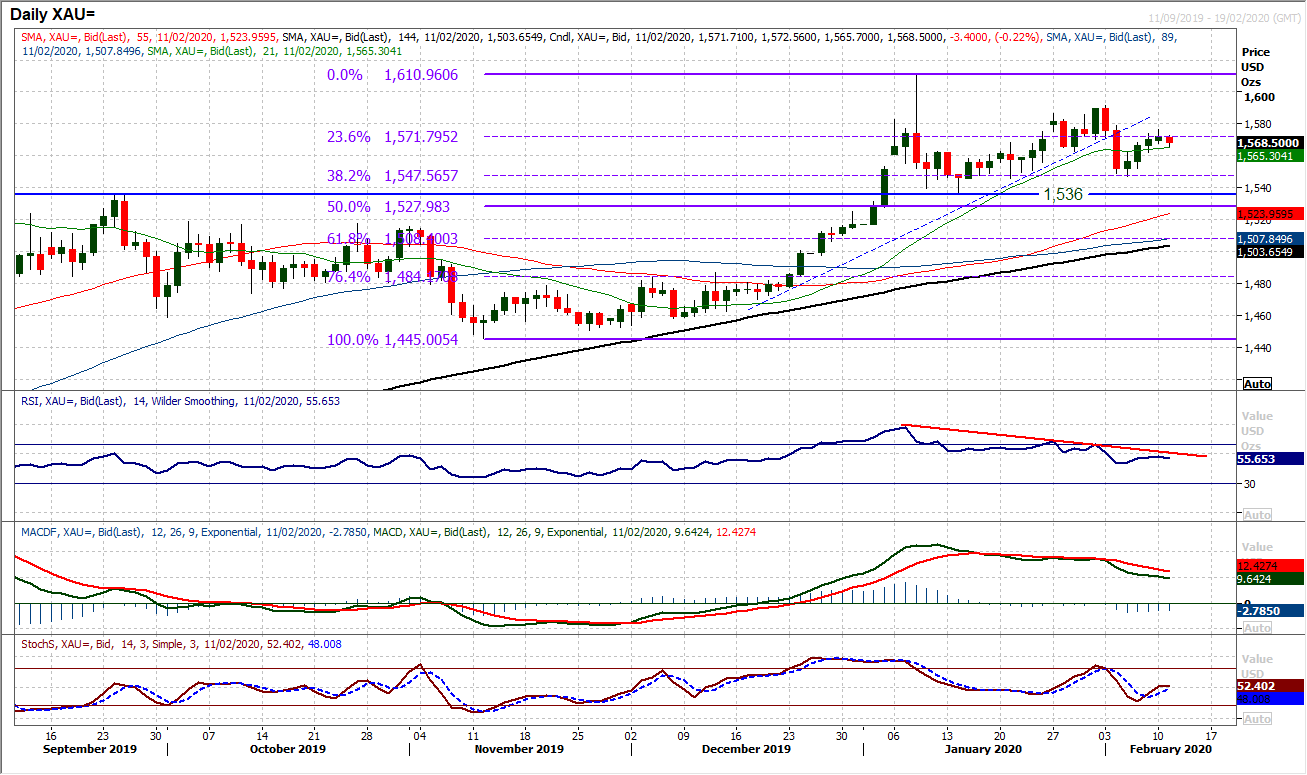
Gold has been grinding out daily gains in the past few sessions, rather than pushing decisively forward. A fourth consecutive positive close has been seen, but the candlestick bodies have been shrinking as the market edge has edged back towards the 23.6% Fibonacci retracement (of $1445/$1611). There is a mild positive bias but an early slip back this morning again adds to the lack of conviction already in the market. We are still mindful of what remains an unwinding slide on medium term momentum indicators such as the RSI (still under 60) and MACD lines, which leaves us concerned over how far this mini rebound can go. Is this the gold market playing out what is going to be a continuation of a five week range? There is not enough yet in this move that would justify chasing the market higher. With the hourly momentum indicators rolling over resistance has been left at $1577. A move back under $1562 support would turn attention back on $1546 again, which is support and also around the 38.2% Fib (at $1548).
WTI Oil
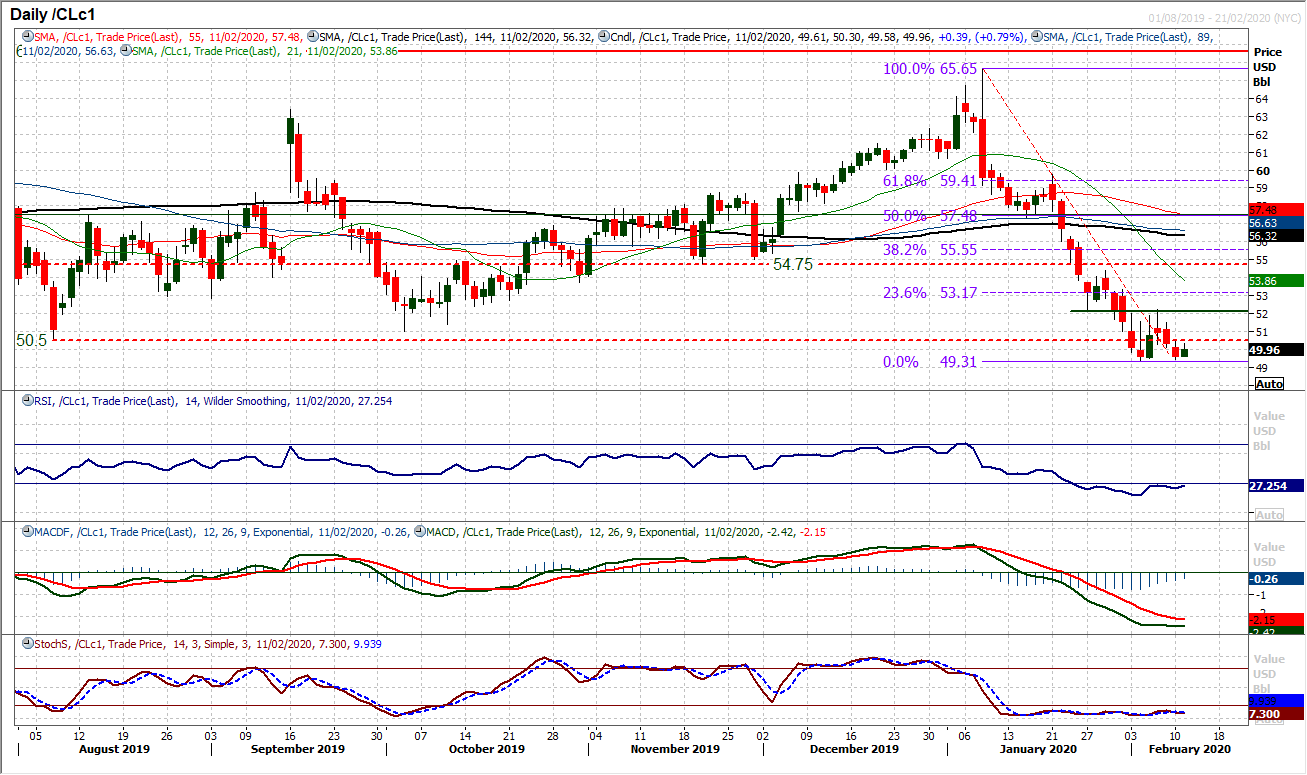
Buying pressure returned just in the nick of time yesterday as the oil price prevented a breach of support of the recent low at $49.30. The tick back higher this morning will have the bulls crossing fingers that this could be their moment. However, the outlook is taking on an air of uncertainty now, rather than more of a recovery feel. The formation of a serious recovery needs a move above the pivot at $52.20 to hold any sustainability. Momentum is beginning to pick up though, as the RSI seems to be trying to bottom. There is little response yet from Stochastics or MACD lines, so it is still too early to call a bottom. Despite this, on the hourly chart there is more of a ranging configuration forming across momentum indicators. Moving back above resistance at $50.50/$51.00 would begin to add more of a positive steer. Losing support at $49.30 would open the way back towards $42.00.
Dow Jones Industrial Average
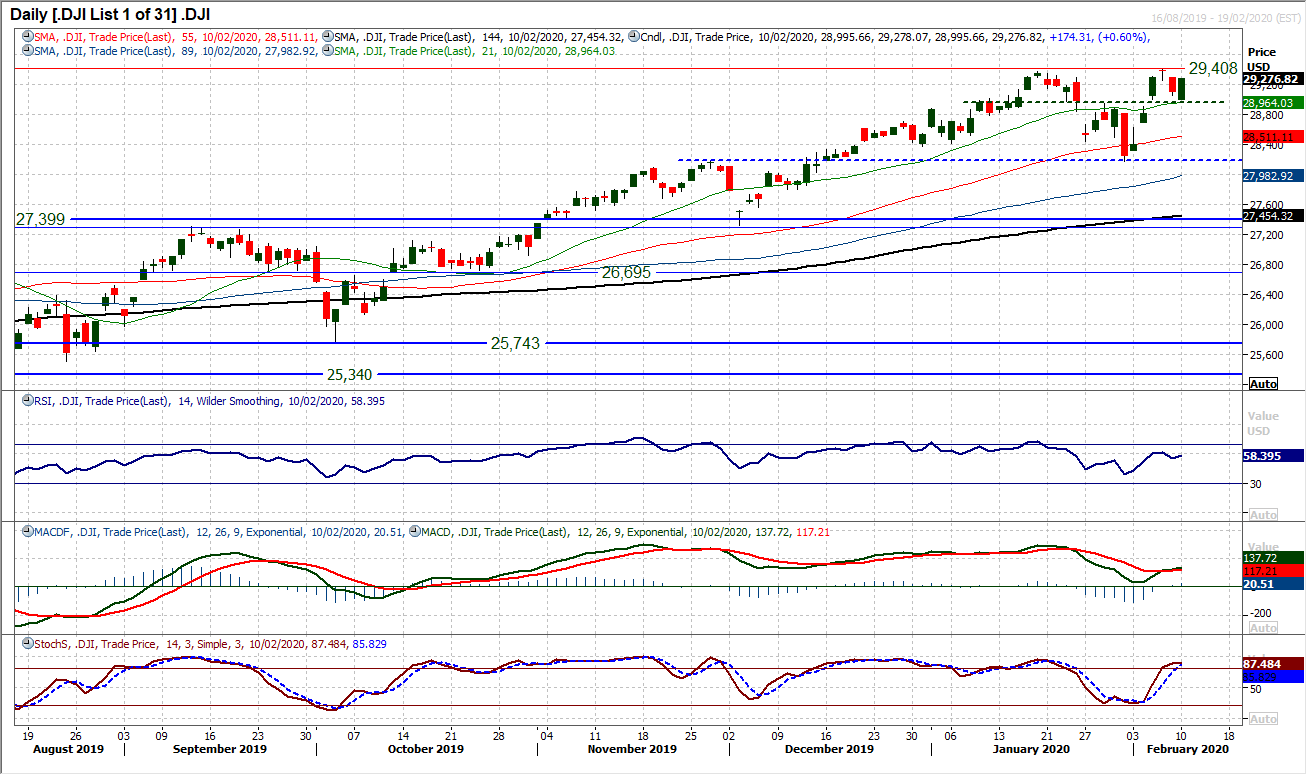
A strong reaction from the bulls has helped to mitigate the corrective impact of what is still a live “evening star” formation on the Dow. The reversal pattern will still need to be watched until the market now moves to a new all-time high above 29,408. Importantly though, there was a response to the pivot band 28,900/28,950 which is growing as a basis of near term support. Furthermore, the fact that the market barely looked back from the positive response to the opening gap lower. Another positive close today would leave support at 28,995 and further bolster the pivot band. Momentum indicators have been wavering somewhat of late, following the evening star three candlestick set up, however in the wake of yesterday’s decisive positive response, there is a positive bias. Joining the S&P 500 in closing at an all-time high (above 29,408) would re-open 30,000 once more.
