Market Overview
After another remarkable day of days on Wall Street, trading sentiment has just lost its positive tone coming into this morning. There has been no decisive trigger, but assets at the safer end of the spectrum are performing better as we come into the European session. Treasury yields falling back helping the dollar to claw back some losses is not the move of a normal/confident market and serves as a warning that any return to outright risk aversion will result in renewed strength of the dollar once more. The past week has seen decent risk recovery as traders take the positives from the discussion and some implementation of exit strategies from their lockdowns. However, this morning, traders seem to be a little reticent to follow Wall Street’s lead. The yen is outperforming on major forex, whilst equities are slipping back. Market reaction around the recovery uptrends on silver and Aussie/Yen will be interesting barometers of broad sentiment now. Reaction around US corporate earnings in addition to what will likely prove to be shocking data for March’s US retail sales and industrial production could also be a key gauge for whether the glass is half full or whether it is now half empty.

Wall Street closed another positive session with good gains, with S&P 500 +3.1% at 2846. However, the E-mini S&P futures are -0.4% early today and Asian markets have met that decline (Nikkei -0.4%, Shanghai Composite -0.5%). European markets are also similarly slipping early today. In forex, there is a risk aversion resulting in JPY outperformance, whilst USD is regaining some of its recent lost ground against major forex. AUD and NZD are the key underperformers. In commodities, there is a mixed look to oil after another rout of selling yesterday, whilst the precious metals are beginning to slip back from recent strong gains, with gold a-$15 and silver -2.3%.
It is all about the US data for March on the economic calendar today. US Retail Sales are at 1330BST, with core ex-autos sales expected to dive by -5.0% in March as the bit cities went into lockdown (down from a decline of -0.4% in February). The US Industrial Production for March is also expected to decline by -4.0% on the month, whilst there will also be special attention given to the capacity utilization proportion which is expected to decline to 73.9% (from 77.0% in February). The Bank of Canada is not expected to change rates at 1500BST from the +0.25% (+0.25% previous) so the outlook will be all important.

Chart of the Day – Silver
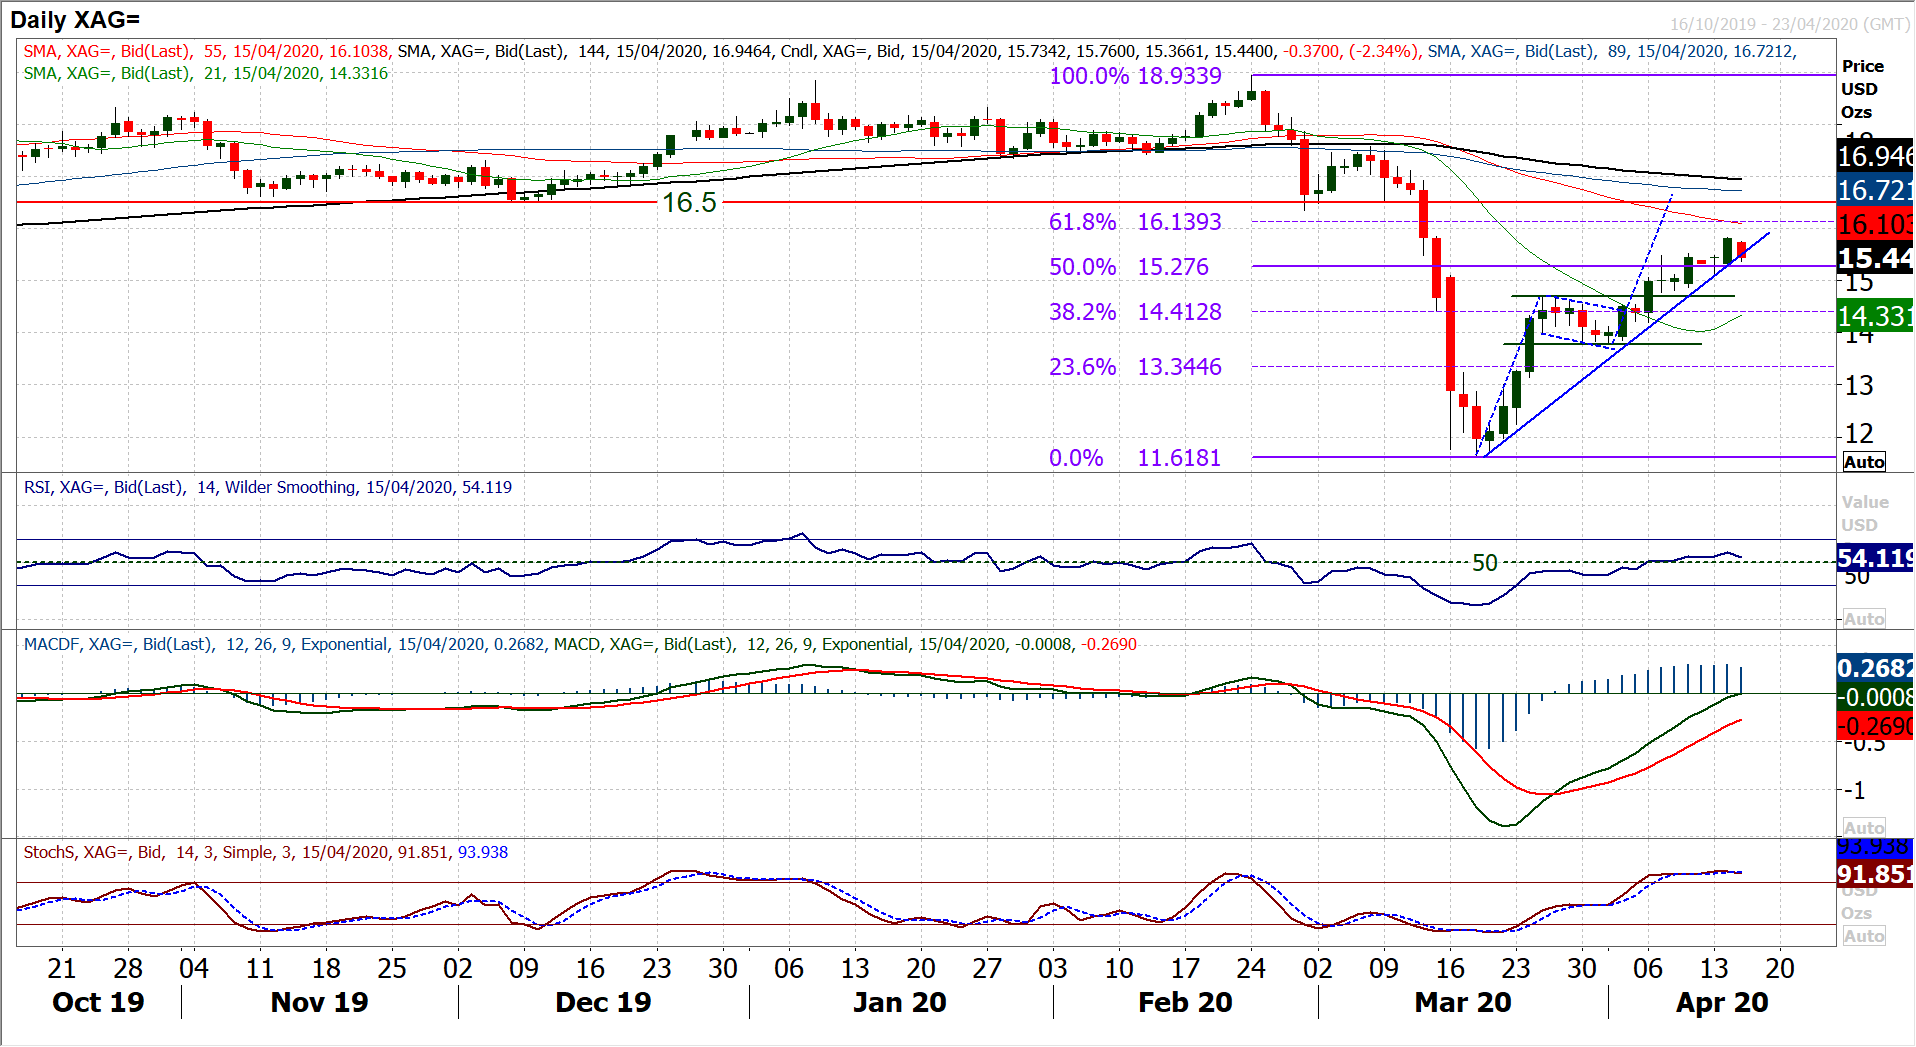
For now, the recovery and recent breakout on silver remains on track, but it is being tested. Having broken above $14.70 last week we looked at the breakout on silver as being a bull flag formation with an implied recovery back for a test of the old key floor at $16.50. Whilst the third phase (breakout) of the rally has not been as aggressive as the first phase (the flag pole), there has been a continued progression of higher lows. This has formed an uptrend up from the $11.62 low but this initial basis of support is being tested as the market has come under pressure early today. The trend comes in around $15.50. However, for now, we remain positive as the recovery is being taken by strength in the momentum indicators as the Stochastics, RSI and MACD which all suggest continued potential in the move. The market used the 50% Fibonacci retracement (of $18.93/$11.62) at $15.28 as the springboard for the bull candle yesterday and continued trading above suggests that the next target remains the 61.8% Fib at $16.14. Yesterday’s high at $15.83 is initial resistance, but beyond this, there is little real resistance until $16.50. Whilst above support at $15.10, the bulls will remain encouraged to buy into weakness. Additionally, The hourly chart shows good support in the band $14.70/$15.10 along with the hourly RSI which remains consistently above 40 to imply weakness is a chance to buy.
EUR/USD
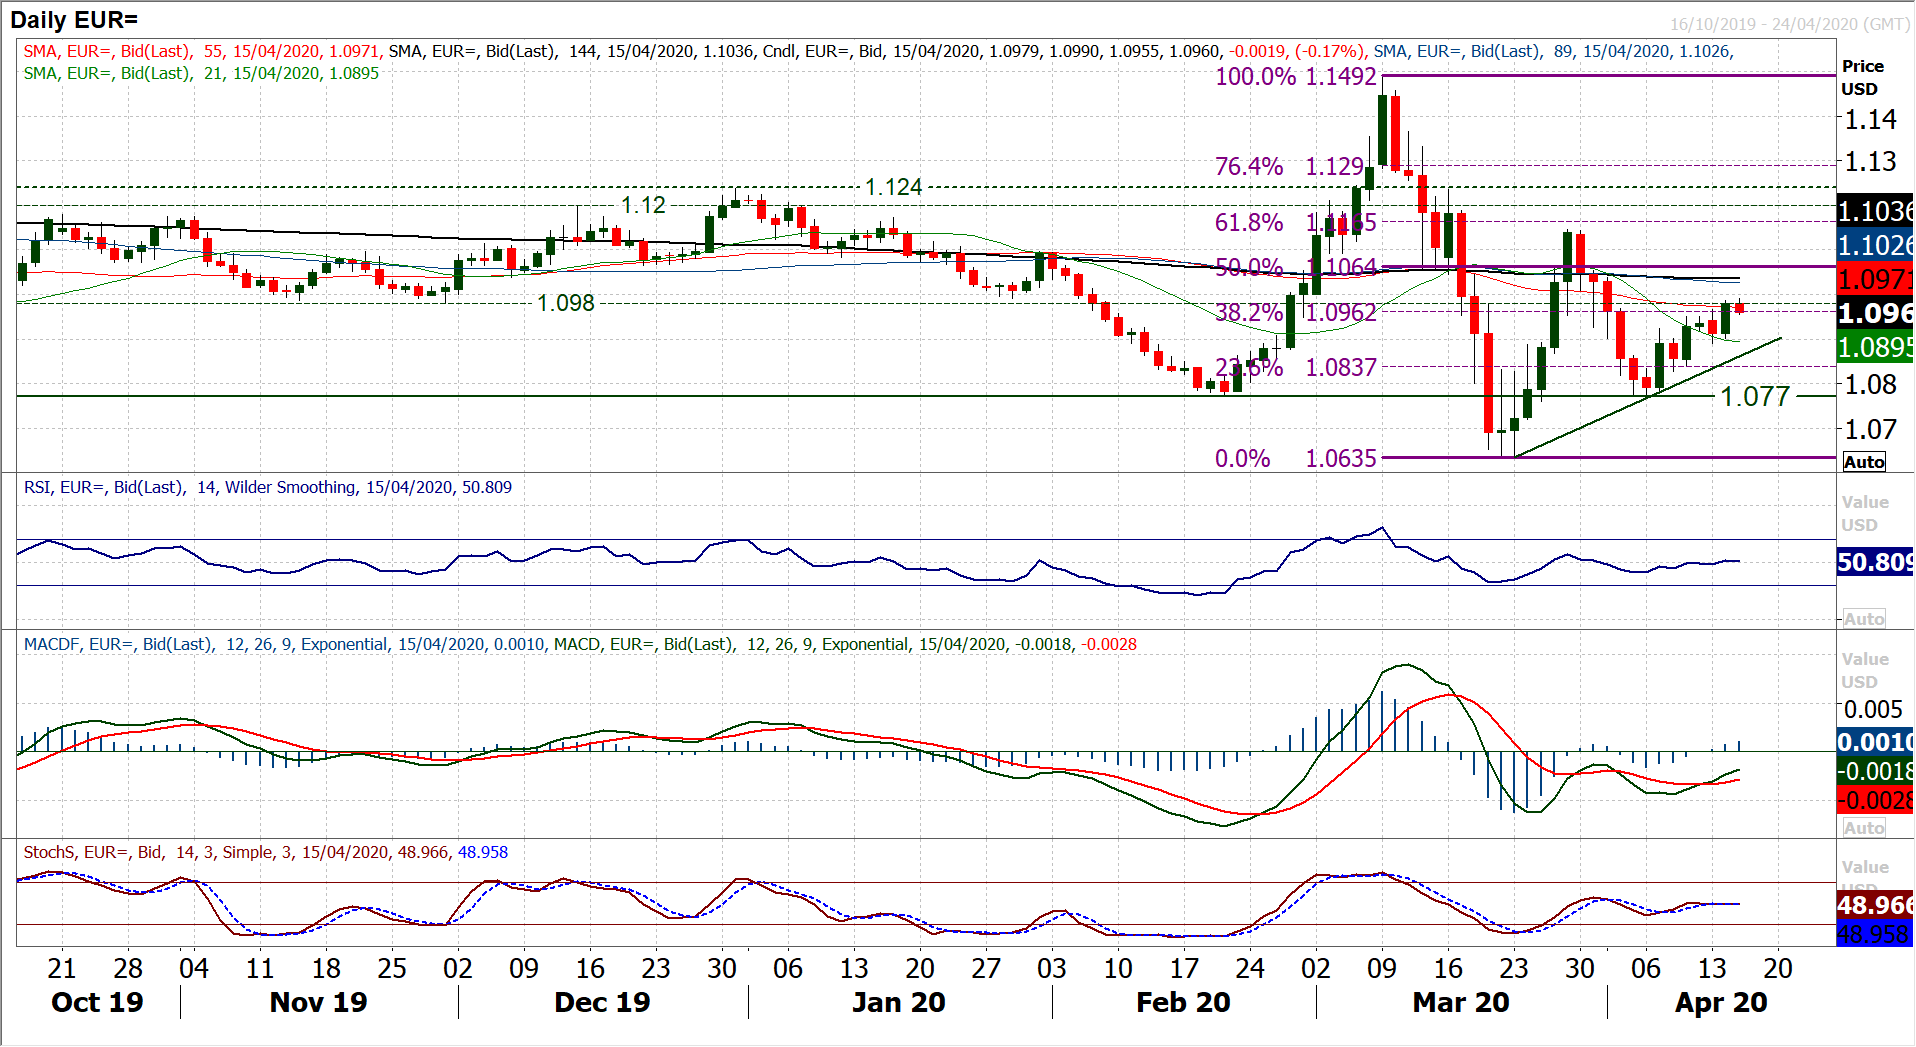
A decisive positive candle got the EUR/USD rally back on track yesterday. The thin volume of the Easter trading period questioned the strength of the near term recovery. However, the bulls fought back really well yesterday in a move which is now threatening to open the legs of the recovery once more. We have been concerned that the resistance in the band $1.1960/$1.1980 would restrict how the recovery developed, but the bulls are in the driving seat of this move now. Leaving aside the thin volume days of the Easter bank holidays, the euro has climbed strongly in three out of four candles. Pressure is growing on $1.1980 for a decisive breakout. As the Europeans take over this morning, there has been a mild slip back, but on the hourly chart this shows as a pullback to a near term breakout of $1.0965. There is a six day uptrend at $1.0935 this morning, and any unwinding move on hourly RSI around 40/50 has been a chance to buy during this uptrend. Initial support is around $1.0950/$1.0965. The bulls will have lost control under $1.0925 and the outlook turns corrective under $1.0890. Above $1.0990 the next resistance is $1.1040.
GBP/USD
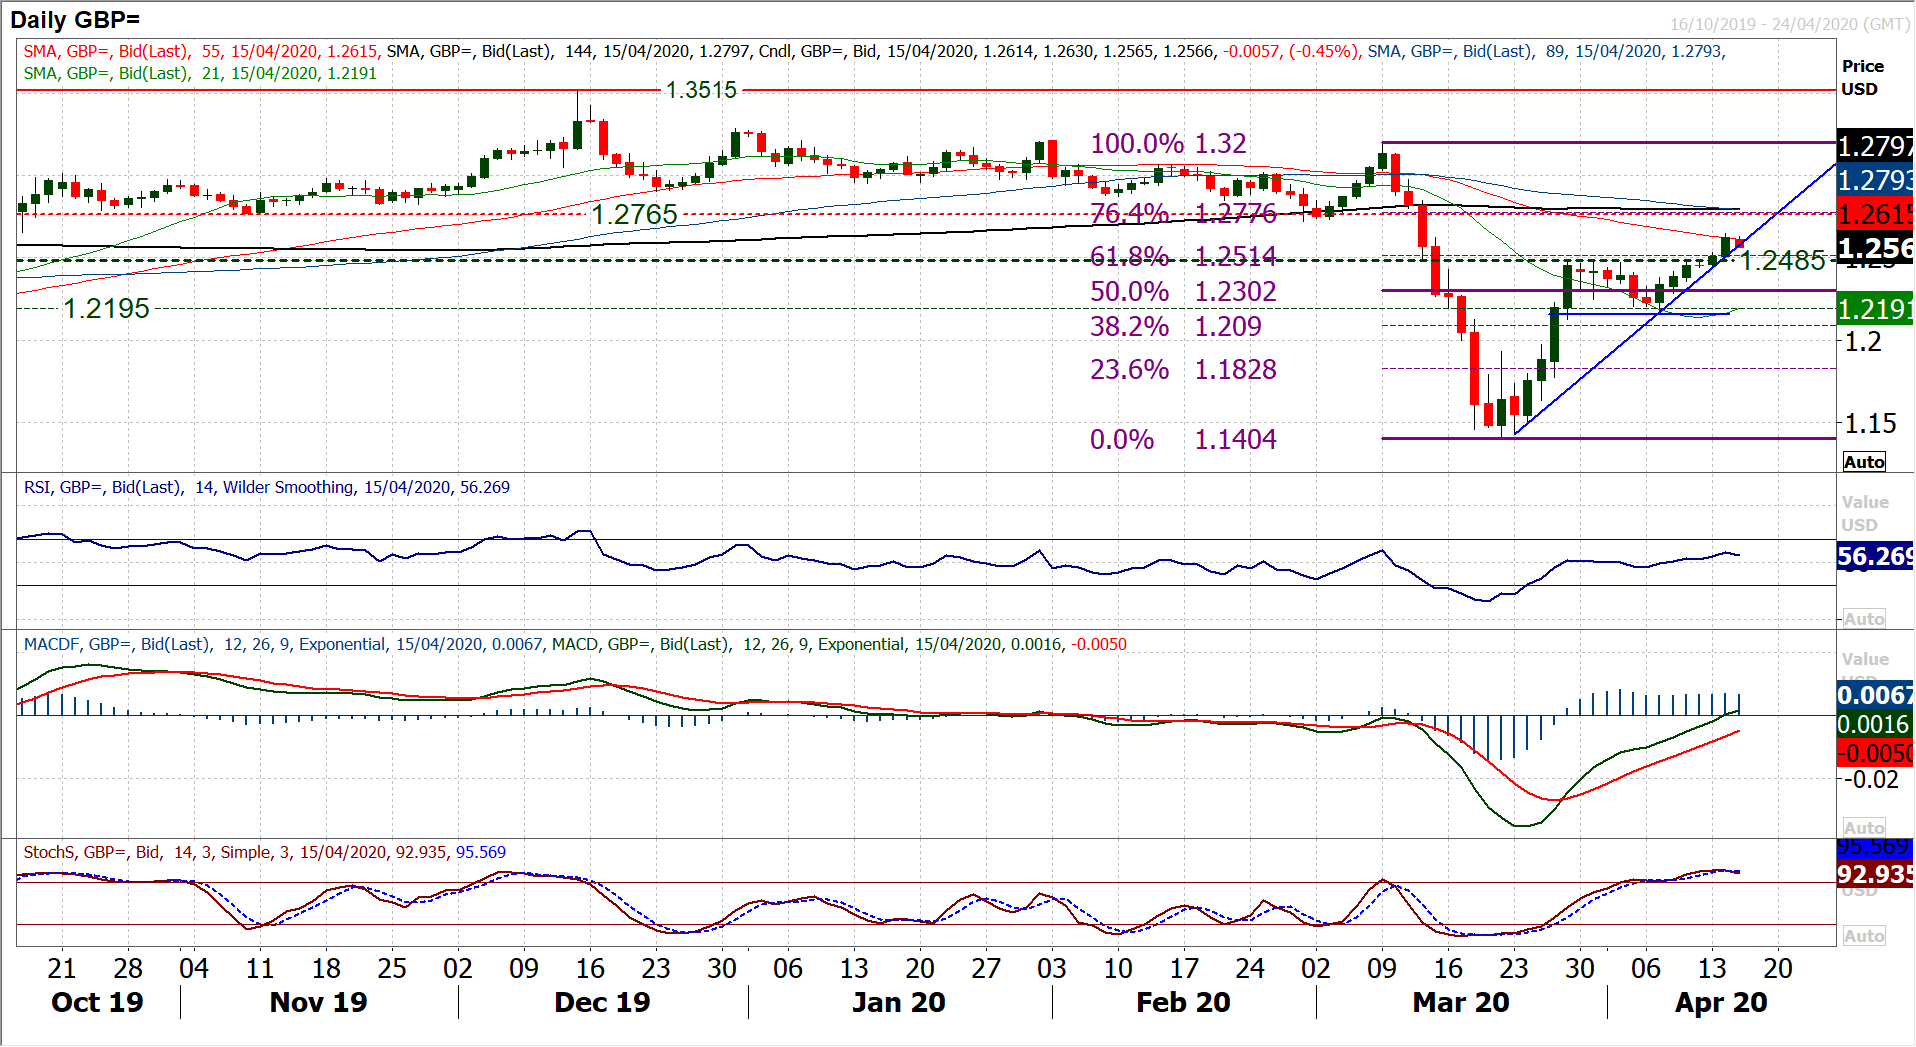
The dollar has struggled in recent sessions which has helped to drive Cable higher in its recovery. Flanked by the uptrend, the decisive break clear of resistance at $1.2485 has completed a consolidation rectangle breakout to imply c. +325 pips towards $1.2800 in the next couple of weeks. This opens the prospect of the market testing what is now overhead supply of $1.2720/$1.2765. Furthermore, the move has also pulled clear of the 61.8% Fibonacci retracement (of $1.3200/$1.1405) at $1.2515 to open 76.4% Fib at $1.2775. Momentum continues to run higher with RSI into the high 50s, however this is now coming into a crucial time for the rally. The previous two failed Cable rallies came with the RSI topping out at 60. So this is a barrier that now needs to be overcome. The sharp uptrend is supportive at $1.2580 today. An early slip back this morning is unwinding some near term overbought momentum on the hourly chart, however, any retreat towards the low 40s on hourly RSI has been used as a chance to buy in recent sessions. There is initial support $1.2540/$1.2580 whilst the breakout at $1.2485 is key.
USD/JPY
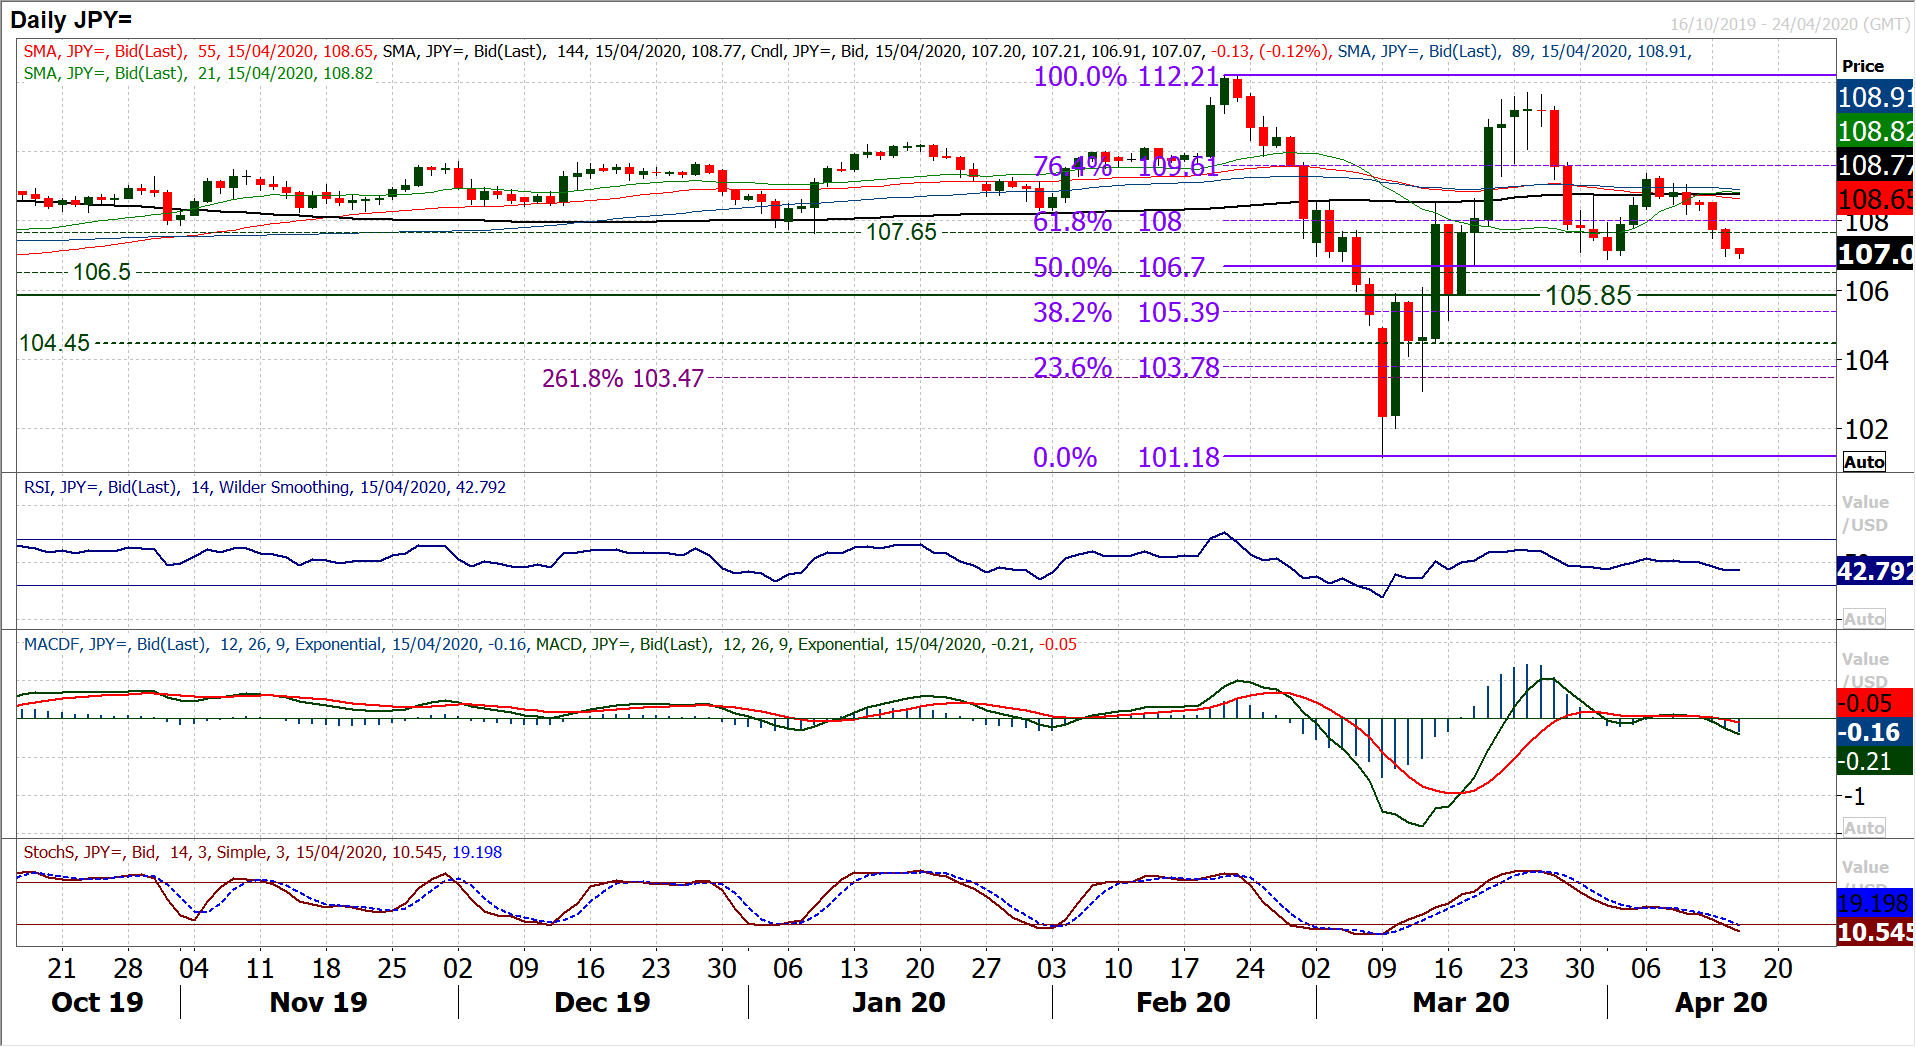
With the dollar under pressure, the yen strength is coming to the fore again to pull USD/JPY lower. The run of negative candlesticks is strengthening and the pressure is growing on the key support at 106.90. This was the initial reaction low from the turn lower from 111.70. A decisive closing breach would mark a key moment for Dollar/Yen and create an increasingly negative outlook. It would mean that a run of lower highs (109.35 would then be key resistance) and lower lows was developing once more. Momentum indicators are already calling for the breakdown, with RSI, MACD and Stochastics all pulling multi-week lows now. The hourly chart reflects this growing negative bias, with a test of 106.90 already this morning, but also hourly RSI failing consistently around the 45/50 area in the past few days. It suggests intraday rallies are a chance to sell. A closing breach of 106.90 would leave an immediate test of the 50% Fibonacci retracement (of 112.20/101.20) at 106.50, with the old Q3 2019 supports between 104.45/105.85 then into play. Above 107.80 improves the near term outlook.
Gold
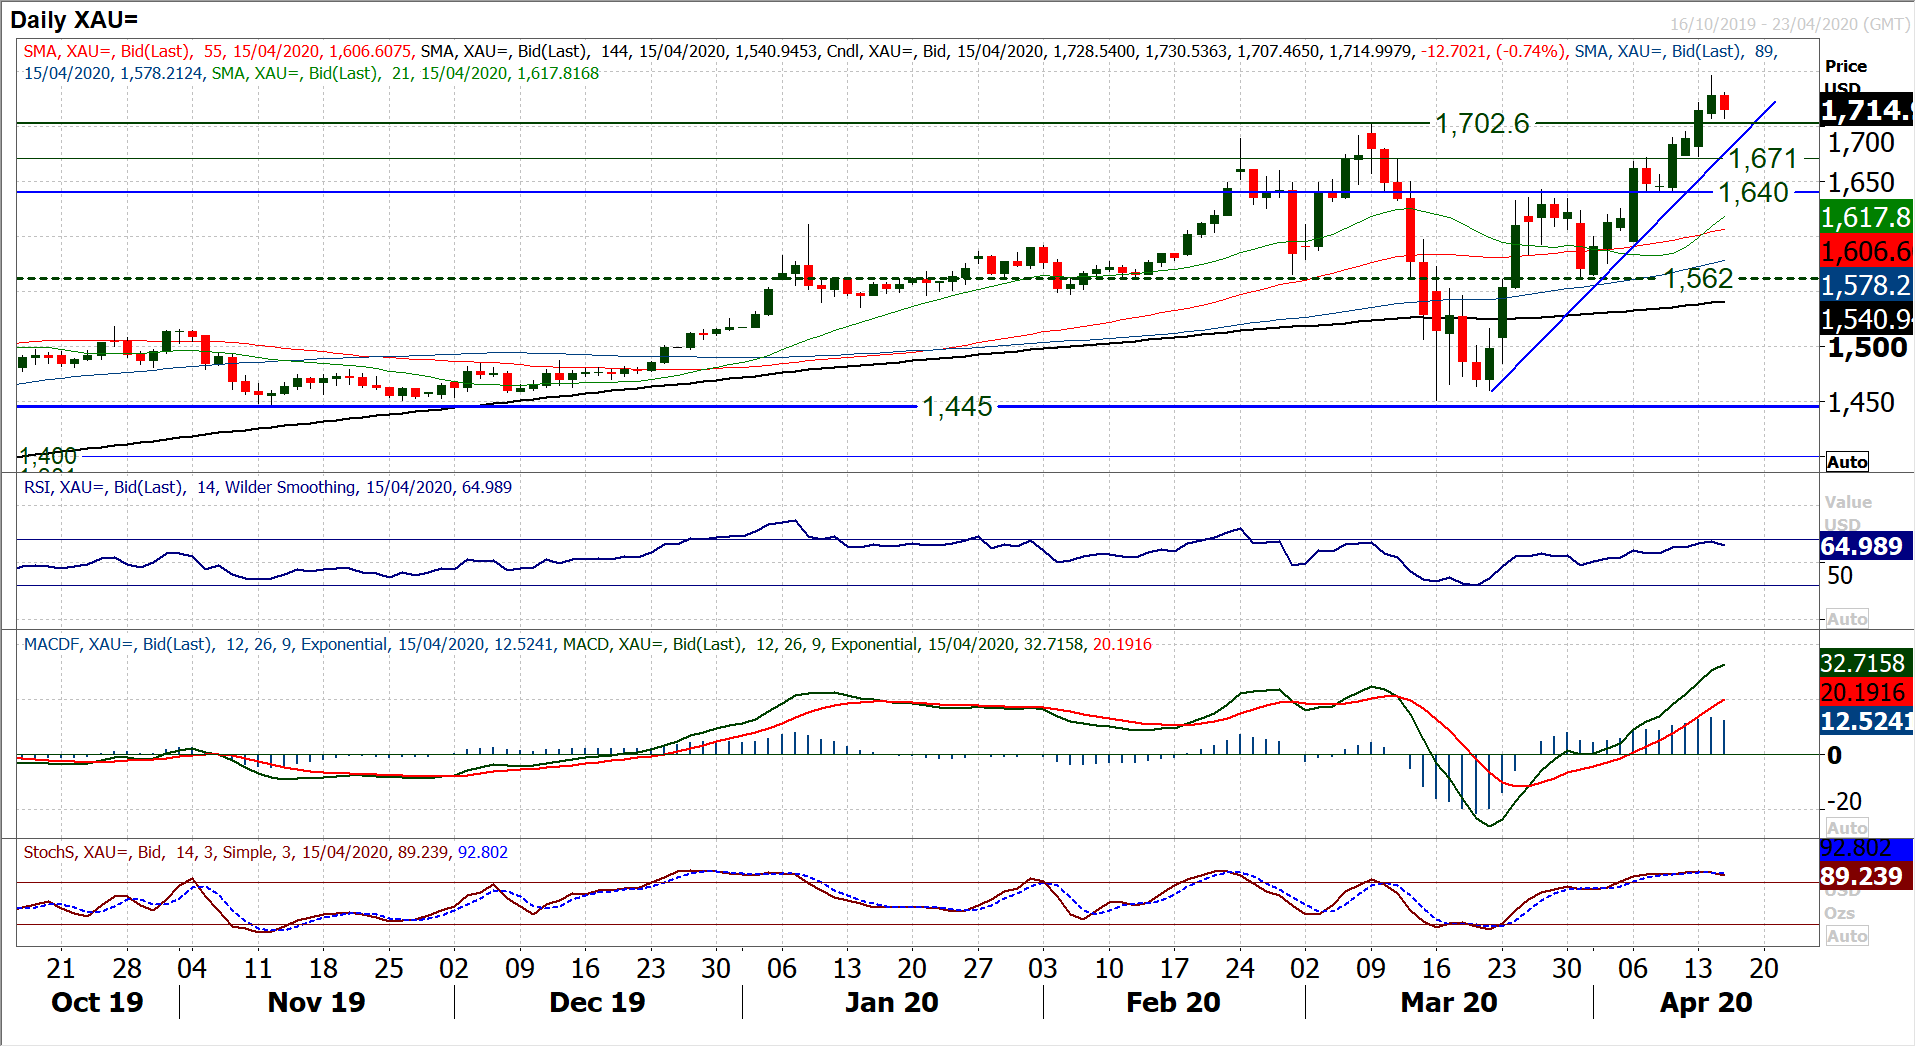
A strong breakout on gold continued to make multi-year highs yesterday and reflects the appetite that the market now has to buy gold. The run is flanked by a sharp uptrend of the past four weeks which comes in at $1675 today, but the run of four consecutive strong bull candles has accelerated the move higher. We have seen this type of bull run on gold on several occasions in the past few months and the move will usually culminate in a blowout candle as momentum becomes overstretched. The similar moves, of early January and late February turned when the RSI was high 70s/80s, so with RSI currently in the mid-60s, there is further upside potential. Buying into intraday weakness has been a feature of this move, with the previous breakouts turning from old resistance into new support. Subsequently, we still see $1702 as a prime buying area. However, the market may not pullback that far, as on the hourly chart we see 40/50 on hourly RSI has been an area where the bulls have often supported intraday. There is however, a slight caveat this morning, with negative divergences on hourly RSI, MACD and Stochastics with the latest breakout. It hints at a slowing of momentum. Near term support sits with the breakout at $1702/$1707 and a failure back under $1702 along with hourly RSI under 40 would be a warning signal. We are happy to buy into this pullback whilst this condition has not been seen. Initial resistance at $1746 is yesterday’s high, whilst beyond that, resistance from 2012 comes in at $1754 and an old key high at $1795.
WTI Oil
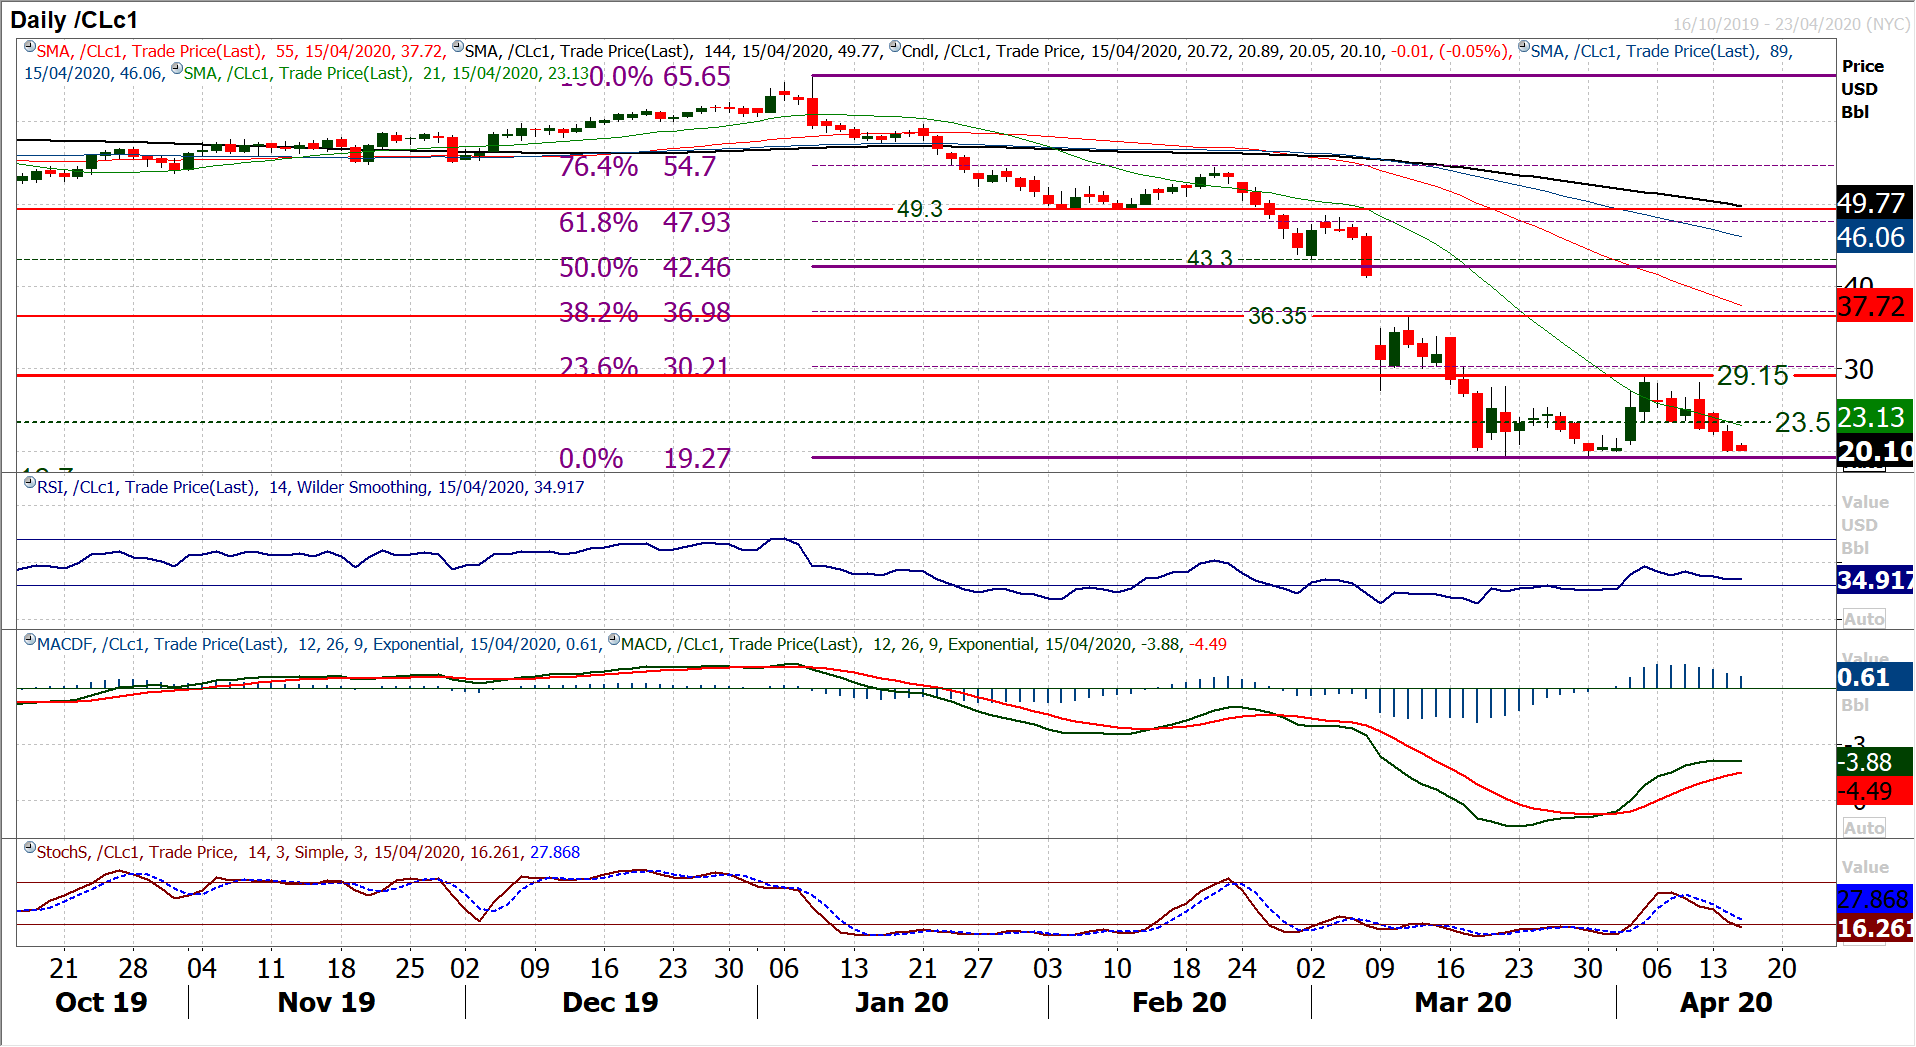
The oil market has certainly not reacted as though the actions of OPEC+ to cut production will go far enough to stem the selling pressure. Another session where an initial hint of buying was quickly dumped on by a deluge of sell orders and WTI fell by over -10%. The concern is that the magnitude of the bear candle really ramped up into the close, something that is never a good sign. The bear pressure on oil is such that the market is now eyeing the crucial low of $19.27 from 30th March. Underneath is not pretty either. There was a minor low of $17.85 from January 2002, but if $19.27 were to be breached it would be a 19 year low and the 16.70 November 2001 low is the next real reference of “support”. The concern is that whilst momentum remains significantly bearish, there is still downside potential with the daily RSI falling in the mid-30s whilst Stochastics are renewing their aggressive move lower. Intraday rallies will also be treated as a chance to sell whilst the run of lower highs continues. There is initial resistance at $20.90 on the hourly chart, before $22.00 and the more considerable resistance ramps up between $23.00/$24.00.
Dow Jones Industrial Average
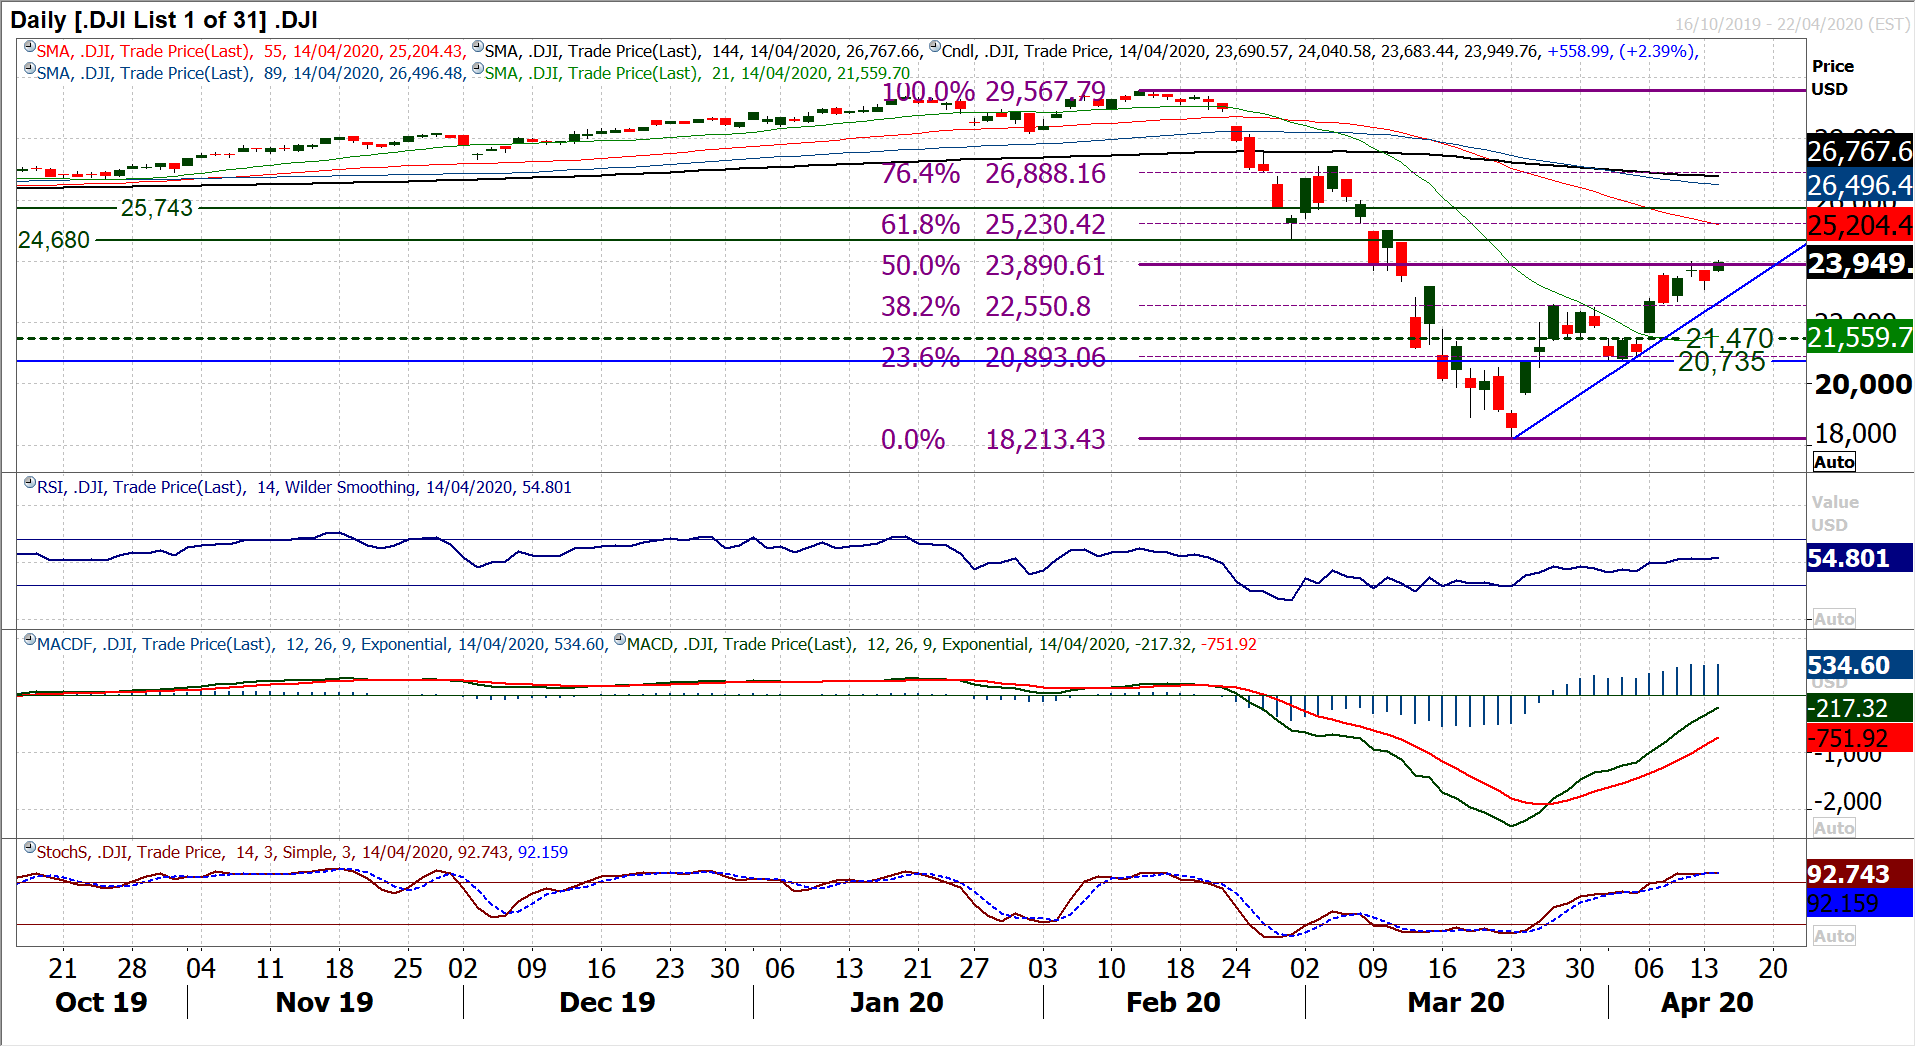
The recovery on Wall Street has been remarkable. With yesterday’s latest positive session which added another 2.4%, the market has now retraced over 50% of the massive sell-off. With momentum indicators tracking solidly higher in the recovery, with upside potential, there is little reason to back against this move right now. There is an uptrend from the March low of 18,213 which comes in at 22,965 today whilst Monday’s low of 23,095 is another point at which the bulls have used weakness as a chance to buy. Decisively clearing the 50% Fibonacci retracement (of 29,567/18,213) at 23,890 is the aim for this session today. This would leave a test of the next resistance band 24,680/25,020. The key support remains the breakout band 25,480/25,595 for the bulls to remain on track.
