Market Overview
The US Senate has passed the massive $2 trillion stimulus bill aimed at mitigating the negative economic impact of the Coronavirus. Now the bill will move to the House of Representatives on Friday, with the bill expected to pass fairly comfortably. However, the positive sentiment arising from the US Congress seemingly able to agree on a fiscal package of such enormity, has dissipated overnight. Sentiment is looking more defensive with a negative bias once more today. This will be an important first test of the sustainability of the rebound we have seen in the past couple of sessions. The move back into safety comes ahead of the first big indication of how Coronavirus is impacting on the US economy. US Weekly Jobless Claims are expected to explode higher today, in what is likely to be well above 1.00m. Keeping in mind that at the height of the 2008 financial crisis, jobless claims peaked at 665,000 it could be a massive shock to markets and a wake up call as to just how big this economic shock is. For now though, we see Treasury yields being relatively settled, with volatility on bonds falling. This is beginning to pull a more settled look to major markets (even if they are trading back lower today). US futures are over -1% lower early today but at least the torrent of selling has calmed down. It will be interesting to see if this remains the case after jobless claims today. The UK’s Office of National Statistics is now releasing key UK data before the market opens (at 0700GMT) and so UK Retail Sales posted a mild downside surprise at -0.5% month on month on an ex-autos basis (-0.2% exp). This will not help what is looking to be a risk negative bias early in the European session.

Wall Street closed with gains last night (although off the highs of the session) with the S&P 500 +1.1% at 2475. US futures are -1.4% initially today and this has seen a slip back on Asian markets, with the Nikkei -4.5% and Shanghai Composite -0.6%. In Europe, the FTSE futures are -2.2% and DAX futures -2.5%. In forex, there is a mild risk negative bias forming, with JPY and CHF being the standout performers, whilst AUD and NZD are slipping. In commodities, it is interesting to see gold still unable to act as a safe haven, trading -0.8% lower, whilst silver is around -1% down. Oil is around -3% lower.
The Bank of England is in focus on the economic calendar, but US employment will be a massive wake up call for markets. The Bank of England monetary policy decision is at 1200GMT but is not expected to show any further changes to the emergency rate cut back to +0.1% and asset purchases to £645bn. This is expected to be a unanimous decision from the 9 members of the MPC. The final reading of Q4 US GDP is at 1230GMT and is expected to be unrevised from the +2.1% of the Prelim read. This is likely to be the last quarter we see of growth like that for a while! However, it could be that Weekly Jobless Claims get the biggest attention of all today, also at 1230GMT. Jobless claims averaged a shade under 220k for several months before spiking to 281,000 last week. According to Reuters consensus estimates, claims are expected to explode to 1.00m last week. Just how big the jump is could have a bearing on market sentiment into the US session.
Chart of the Day – German DAX
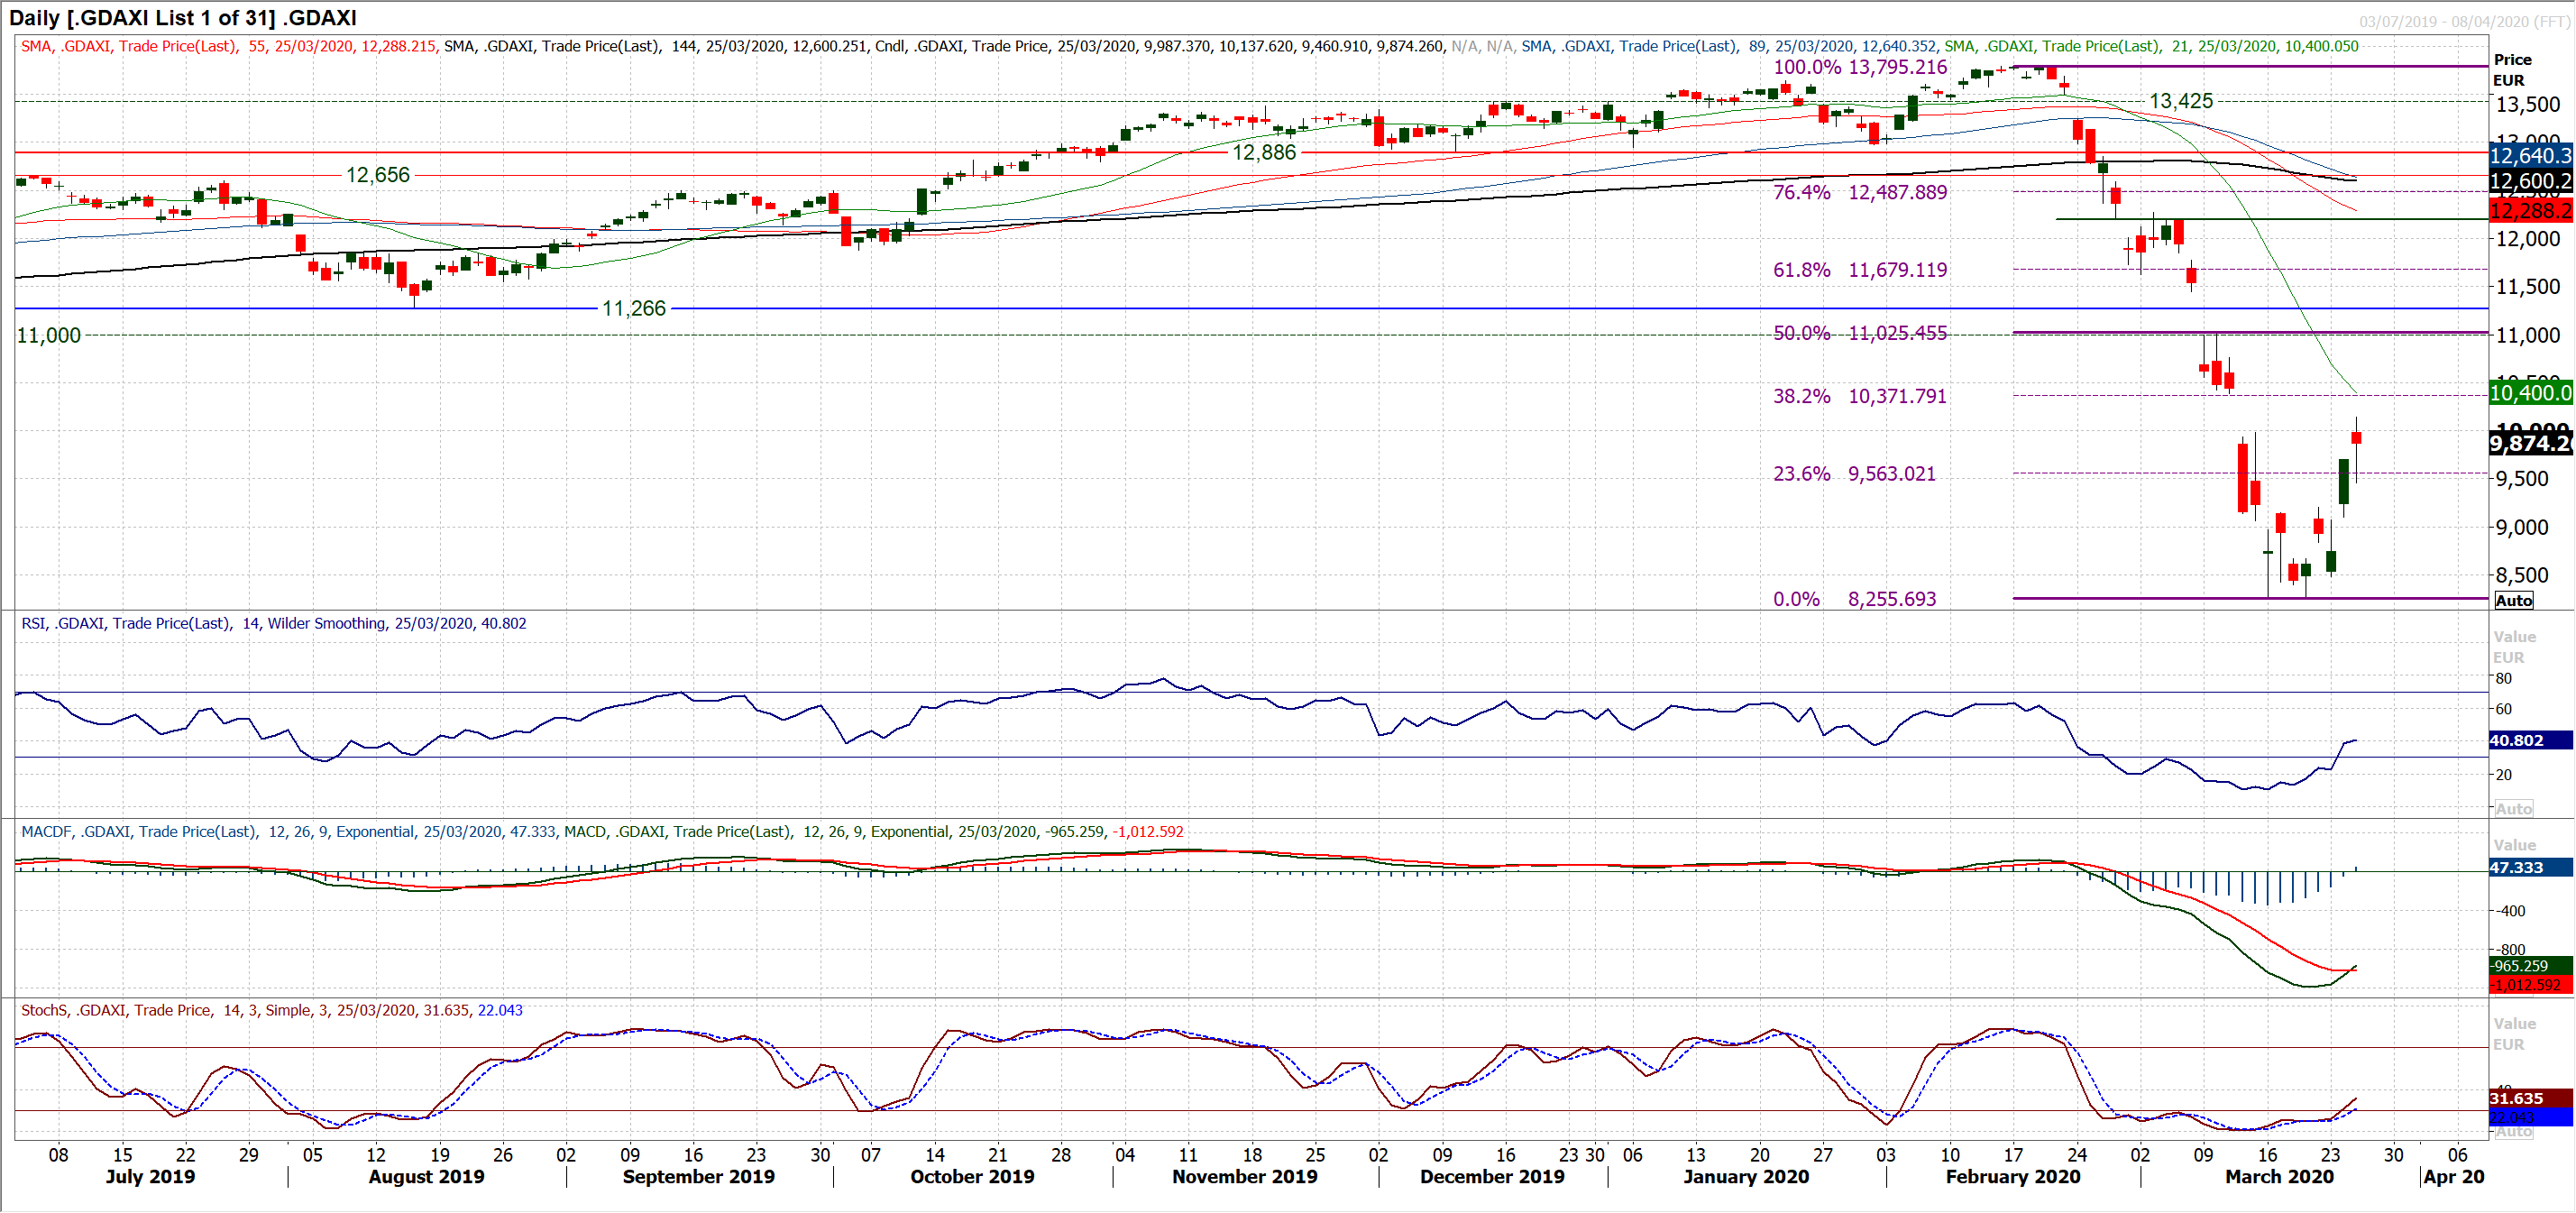
Equities are on the rebound and many will be asking whether it is a key low that is now in place. Volatility is still massive with wild intraday swings, but there certainly seems to be a recovery forming on the major markets. The DAX is certainly regaining lost ground now and is incredibly now on the verge of officially being in a bull market (which would be great than +20% from the low of 8255). The technicals are improving, with the increased incidence of positive candlesticks (close above the open), even if yesterday’s gain of 174 ticks was slightly less than the opening move. What is encouraging though is that the market is moving higher following the closing of what looks now to have been an “exhaustion” gap, at 9065. The move is also decisively clear of the 23.6% Fibonacci retracement (of the bear market 13,795/8255) at 9563. This opens the 38.2% Fib retracement around 10,370 which also happens to be just around what would be the next gap fill at 10,390. This is therefore the next target of a recovery. Momentum is certainly on a recovery, with Stochastics confirming a bull cross buy signal, along with a bull cross on MACD and RSI rising back above 40. There is clearly plenty of volatility still to play out, but the way this move is shaping, weakness is now being bought into. Even yesterday, the opening bull gap was filled to leave good support 9460/9700 and with futures looking initially lower this morning, this will become an early important gauge. The hourly chart shows neckline support of a base pattern at 9200 with the pattern implying an upside target at 10,150. Hourly RSI holding above 35/40 will maintain the recovery momentum.
EUR/USD
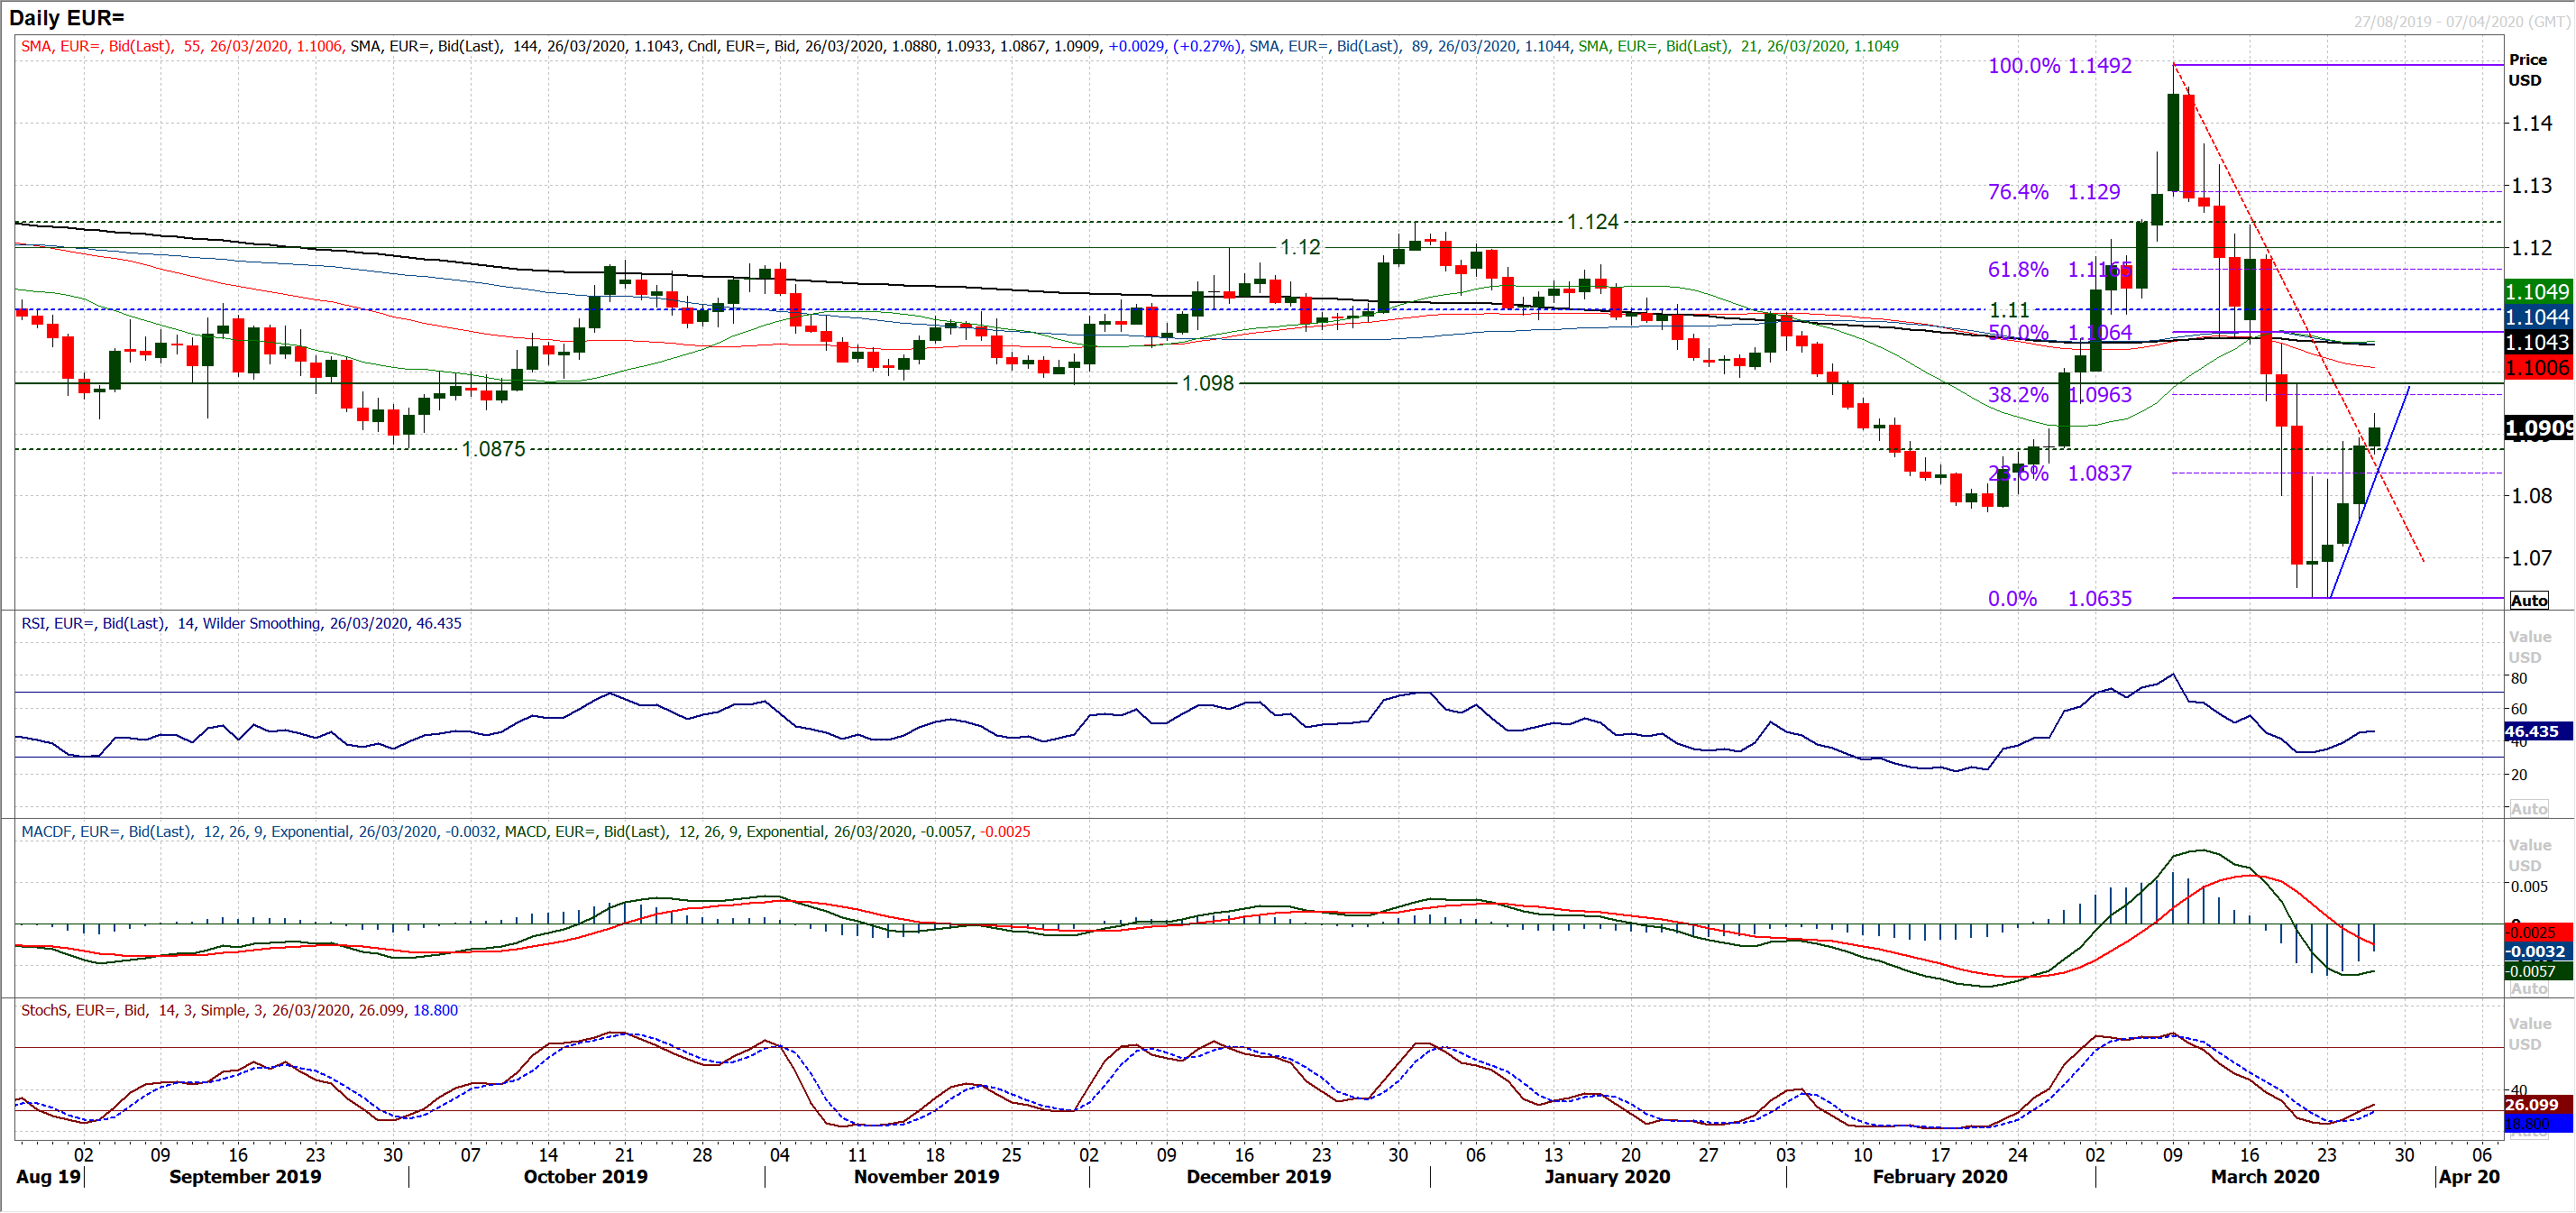
The development of a recovery on the euro (or should that be a corrective move back for the dollar) continued yesterday with another strong gain on the day, but also a decisive positive candlestick. The move higher has now had four positive closes in a row and with further gains today, the recovery is now pushing through key technical barriers. Momentum indicators are turning higher, with a bull cross on Stochastics (close to confirming today) and RSI rising back above 40. We have been focusing on the recovery breaking through the 23.6% Fibonacci retracement (of $1.1492/$1.0635) at $1.0835 this week and with a decisive bull candle yesterday puling clear, there is an increasingly encouraging look to the rebound now. Pulling clear of the old October low of $1.0875 has added further weight to this, whilst also breaking the resistance of the sharp two and a half week downtrend (at $1.0855 today). The next target on the daily chart is the 38.2% Fib around $1.0965. The hourly chart shows a move above $1.0885 has opened the path for a recovery. Already a well-defined uptrend has forming on the hourly chart, with higher lows and higher highs. Intraday weakness is being used as a chance to buy. There is now a good band of support between $1.0830/$1.0885 today which is a near term “buy zone”, which will remain so whilst the hourly RSI remains consistently above 40. The base pattern on the hourly chart above $1.0830 implies a target of around $1.1020. Support of a key higher low is at $1.0745.
GBP/USD
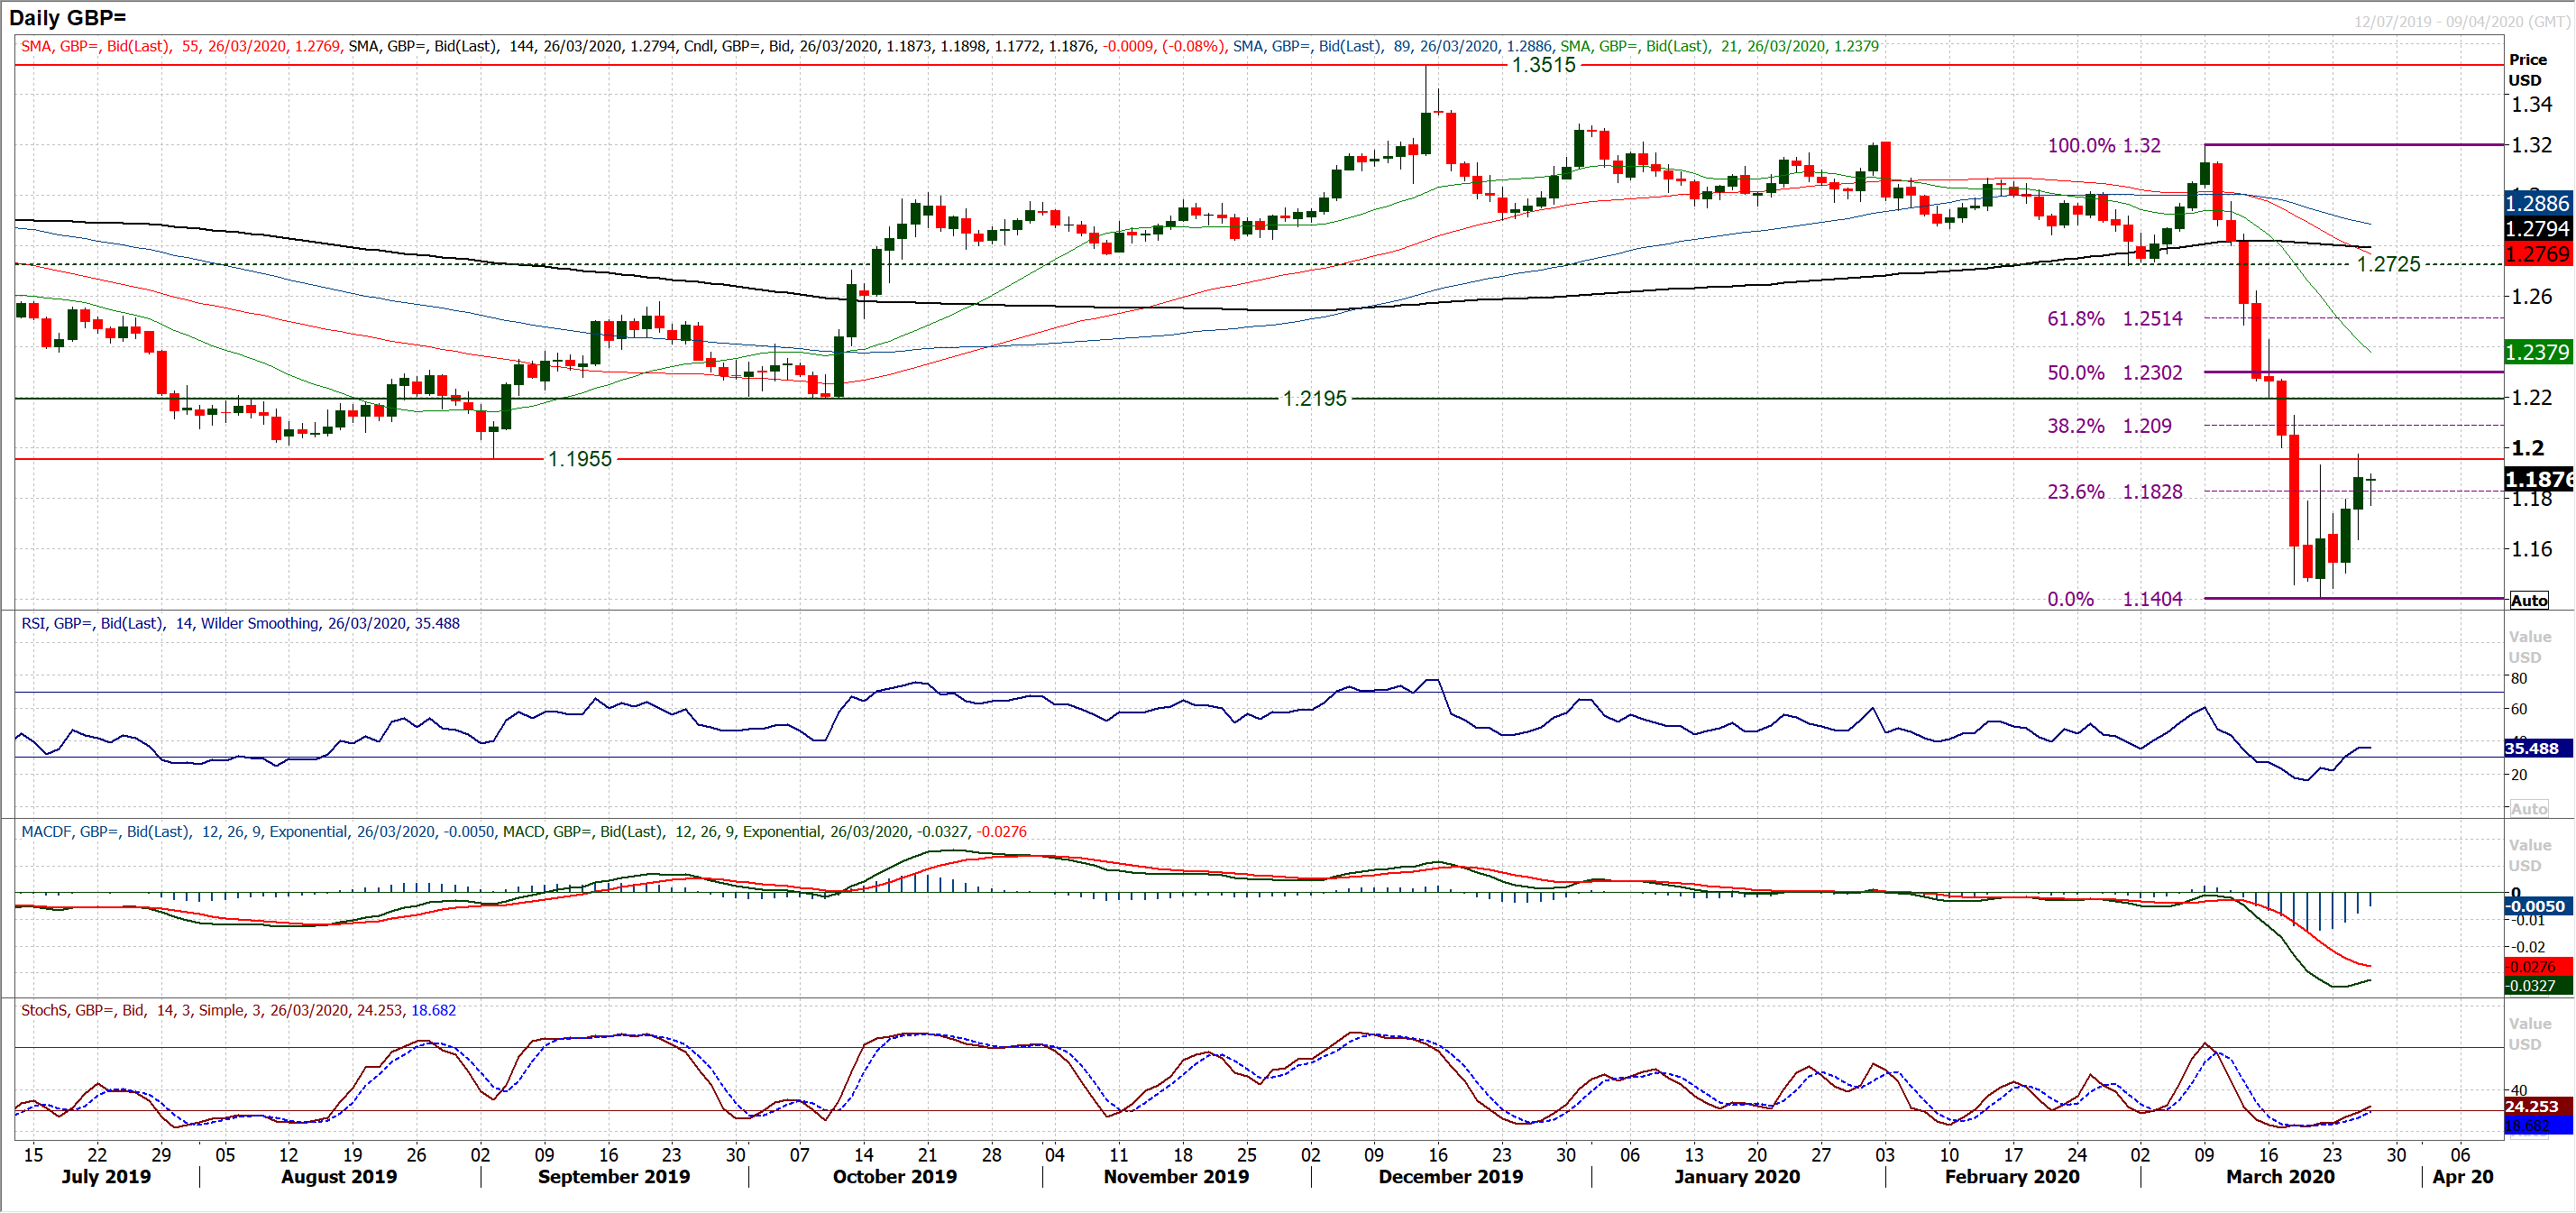
Trading Cable remains the biggest rollercoaster rise in major forex. The huge volatility continues to drive through the price and another day of wild swings yesterday drove a range of 330 pips. The Average True Range is 314 pips today! Two decisive positive candles in a row (and three in the past four sessions) have constructed some sort of a rebound. However, it was notable that as soon as Cable started hitting the resistance of the old September low at $1.1955 the rally began to struggle. Momentum indicators are starting to turn up, but how the market responds around the 23.6% Fibonacci retracement (of the huge $1.3200/$1.1404 sell-off) around $1.1830 today will be a near term gauge. The hourly chart shows the recovery has been tempered slightly in the past 24 hours, but hourly RSI remains above 40 which is encouraging and the hourly moving averages are showing signs of improvement. Initial support at $1.1770 will be watched this morning, whilst the higher reaction low at $1.1635 needs to hold to maintain any sense of recovery. The bulls will still be looking for a close above $1.1930 to complete a 525 pip base pattern, whilst more importantly pulling back above the resistance $1.1955/$1.2000. The immediate outlook has turned a little mixed this morning, but the building blocks of a recovery are still being laid.
USD/JPY
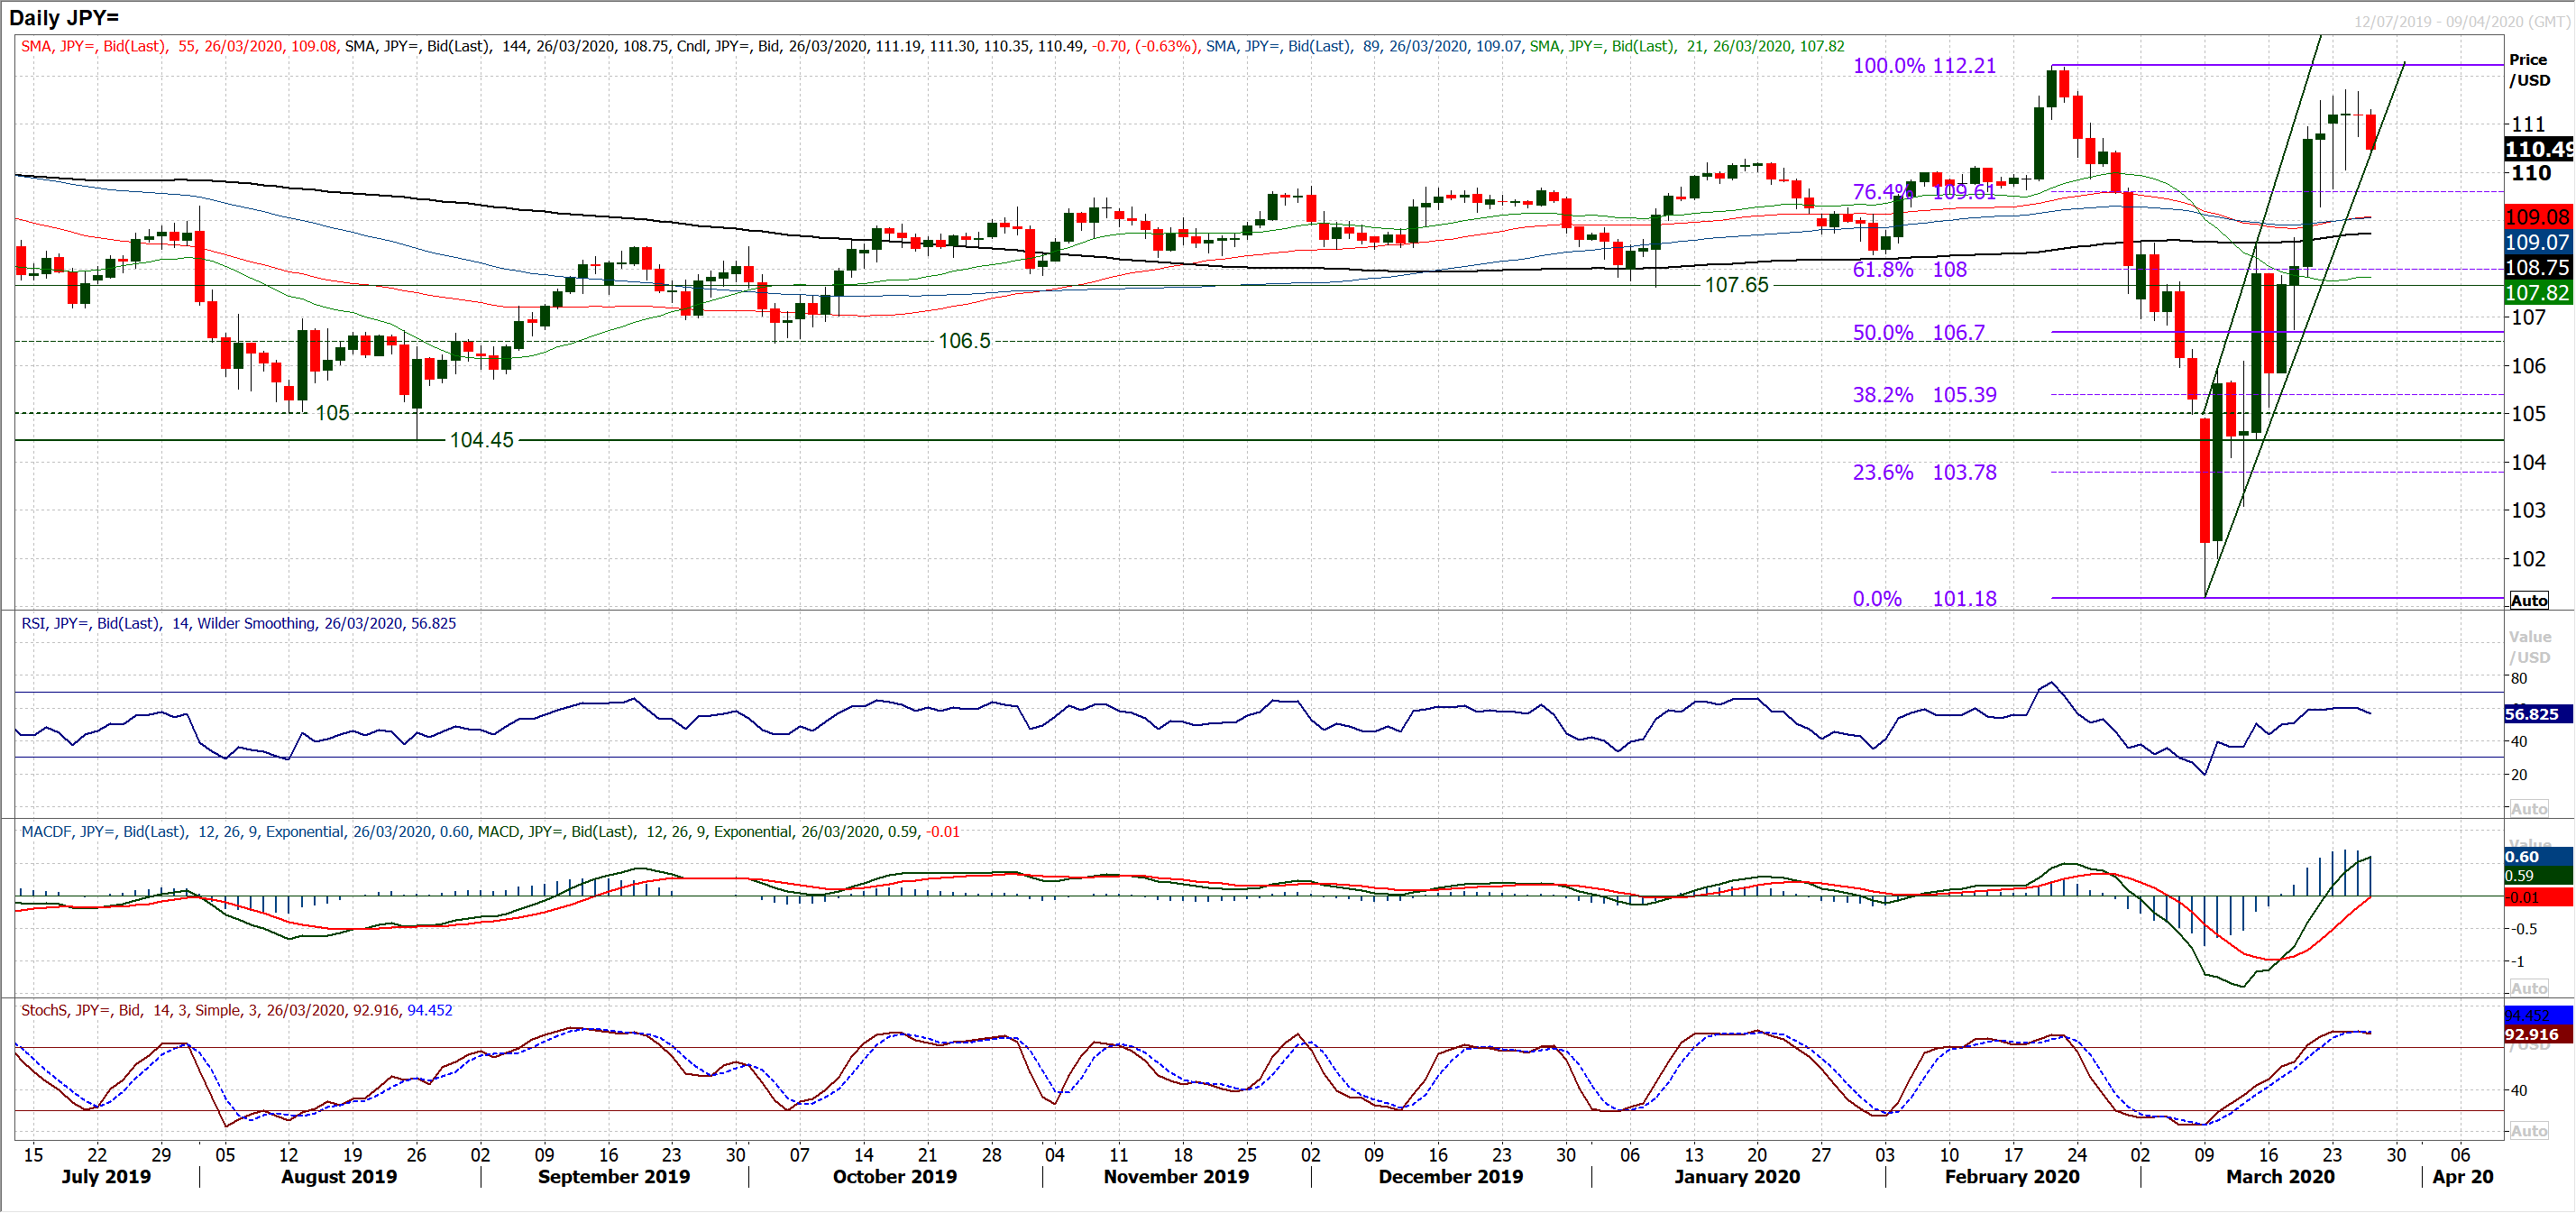
The run higher has been showing increasing signs of fatigue in recent days. The daily candlesticks throughout this week show consolidation and a degree of uncertainty over the strength of the uptrend channel. Effectively posting two “doji” candles in a row, the bull run has stalled and this morning is beginning to turn into reverse. A decisive close lower today could trigger some profit-taking. Momentum indicators are beginning to tail off and roll over. The Stochastics are this morning crossing lower (no confirmation sell signal quite yet) whilst RSI, which has stalled around 60 in recent days, is also pulling lower. We have been looking at the hourly chart for potential deterioration and it is now beginning to come. The hourly RSI has been holding well above 40 for the past couple of weeks and has now faltered under it, whilst the MACD lines have dropped below neutral. Hourly moving averages are rolling over too. Resistance has been left at 111.70 and the first important near term support at 110.05 is being eyed. A move below 109.65 adds to corrective momentum and below 109.30 would confirm.
Gold
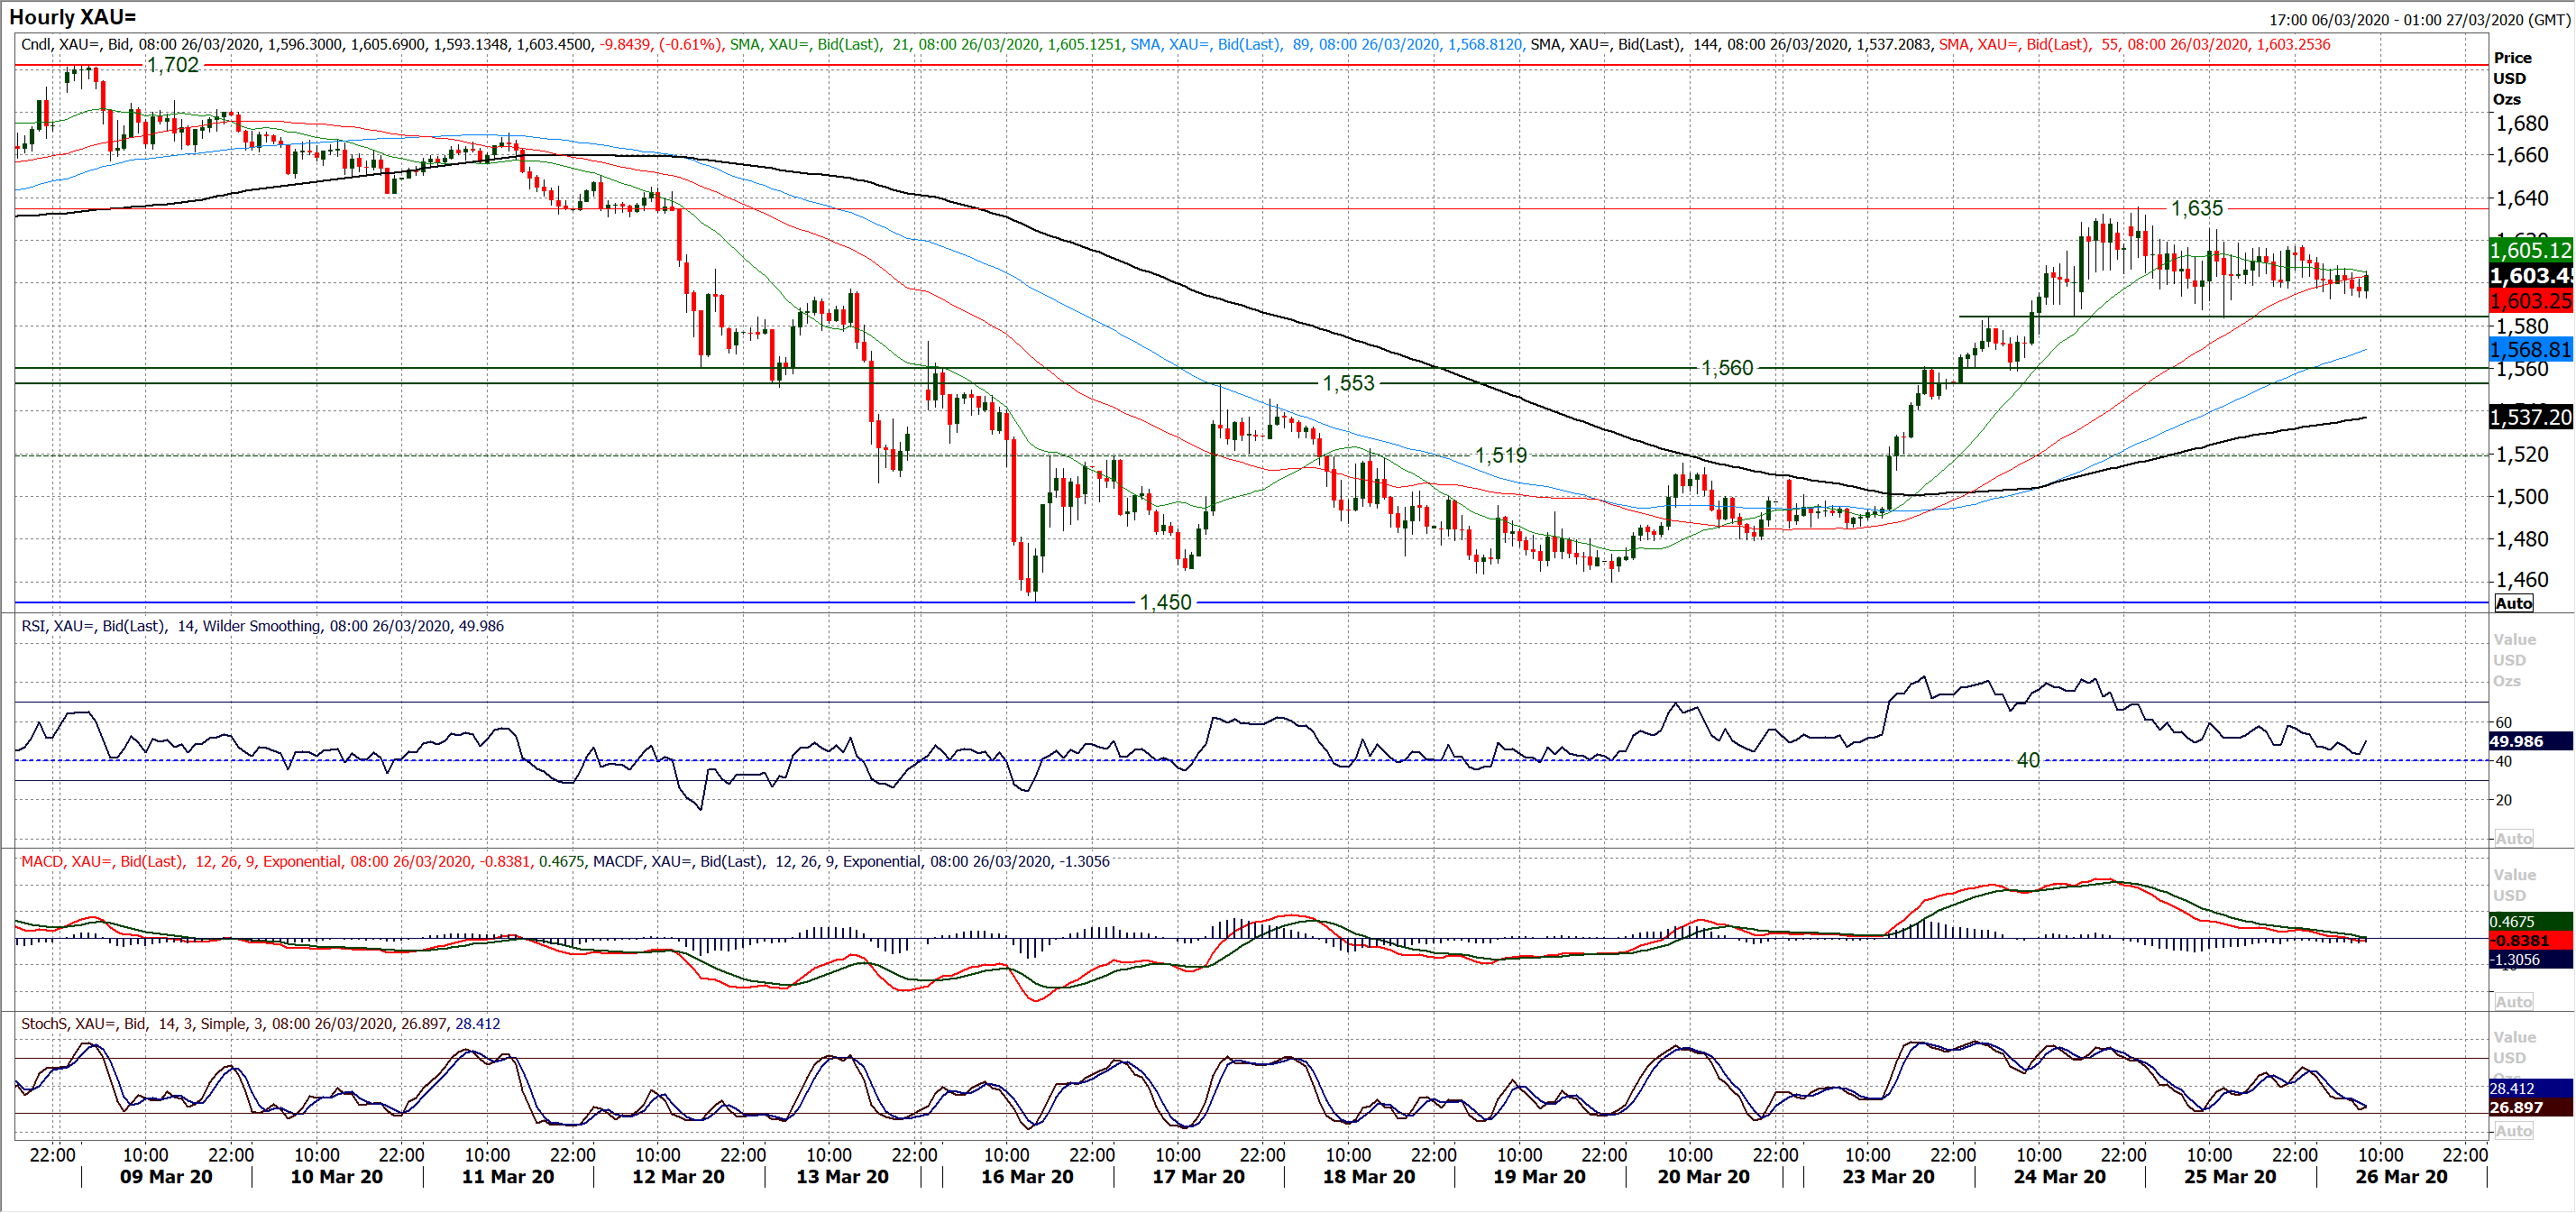
The sharp bull run (which added around 12% back on to gold) has just begun to roll over. The near term positive momentum is just turning into consolidation. The daily chart shows a small negative candle yesterday (albeit with a positive close) but this is now being pulled lower this morning. The impetus in the rise on Stochastics and RSI is tempering. The hourly chart shows this as more of a consolidation but the price is still at risk of a near term drift back towards the key breakout $1553/$1560 which is a pivot area. The hourly chart also shows the initial support to watch remains at $1585 which has turned into a pivot over the past couple of days. A drop below $1585 would open the move towards $1553/$1560. Resistance is beginning to form under the $1635 rebound high, at $1625 and $1617 today. Gold has turned into a near term consolidation with corrective potential (especially if hourly RSI begins to fall below 40). However, we would continue to view near term weakness on gold as a medium term buying opportunity.
WTI Oil
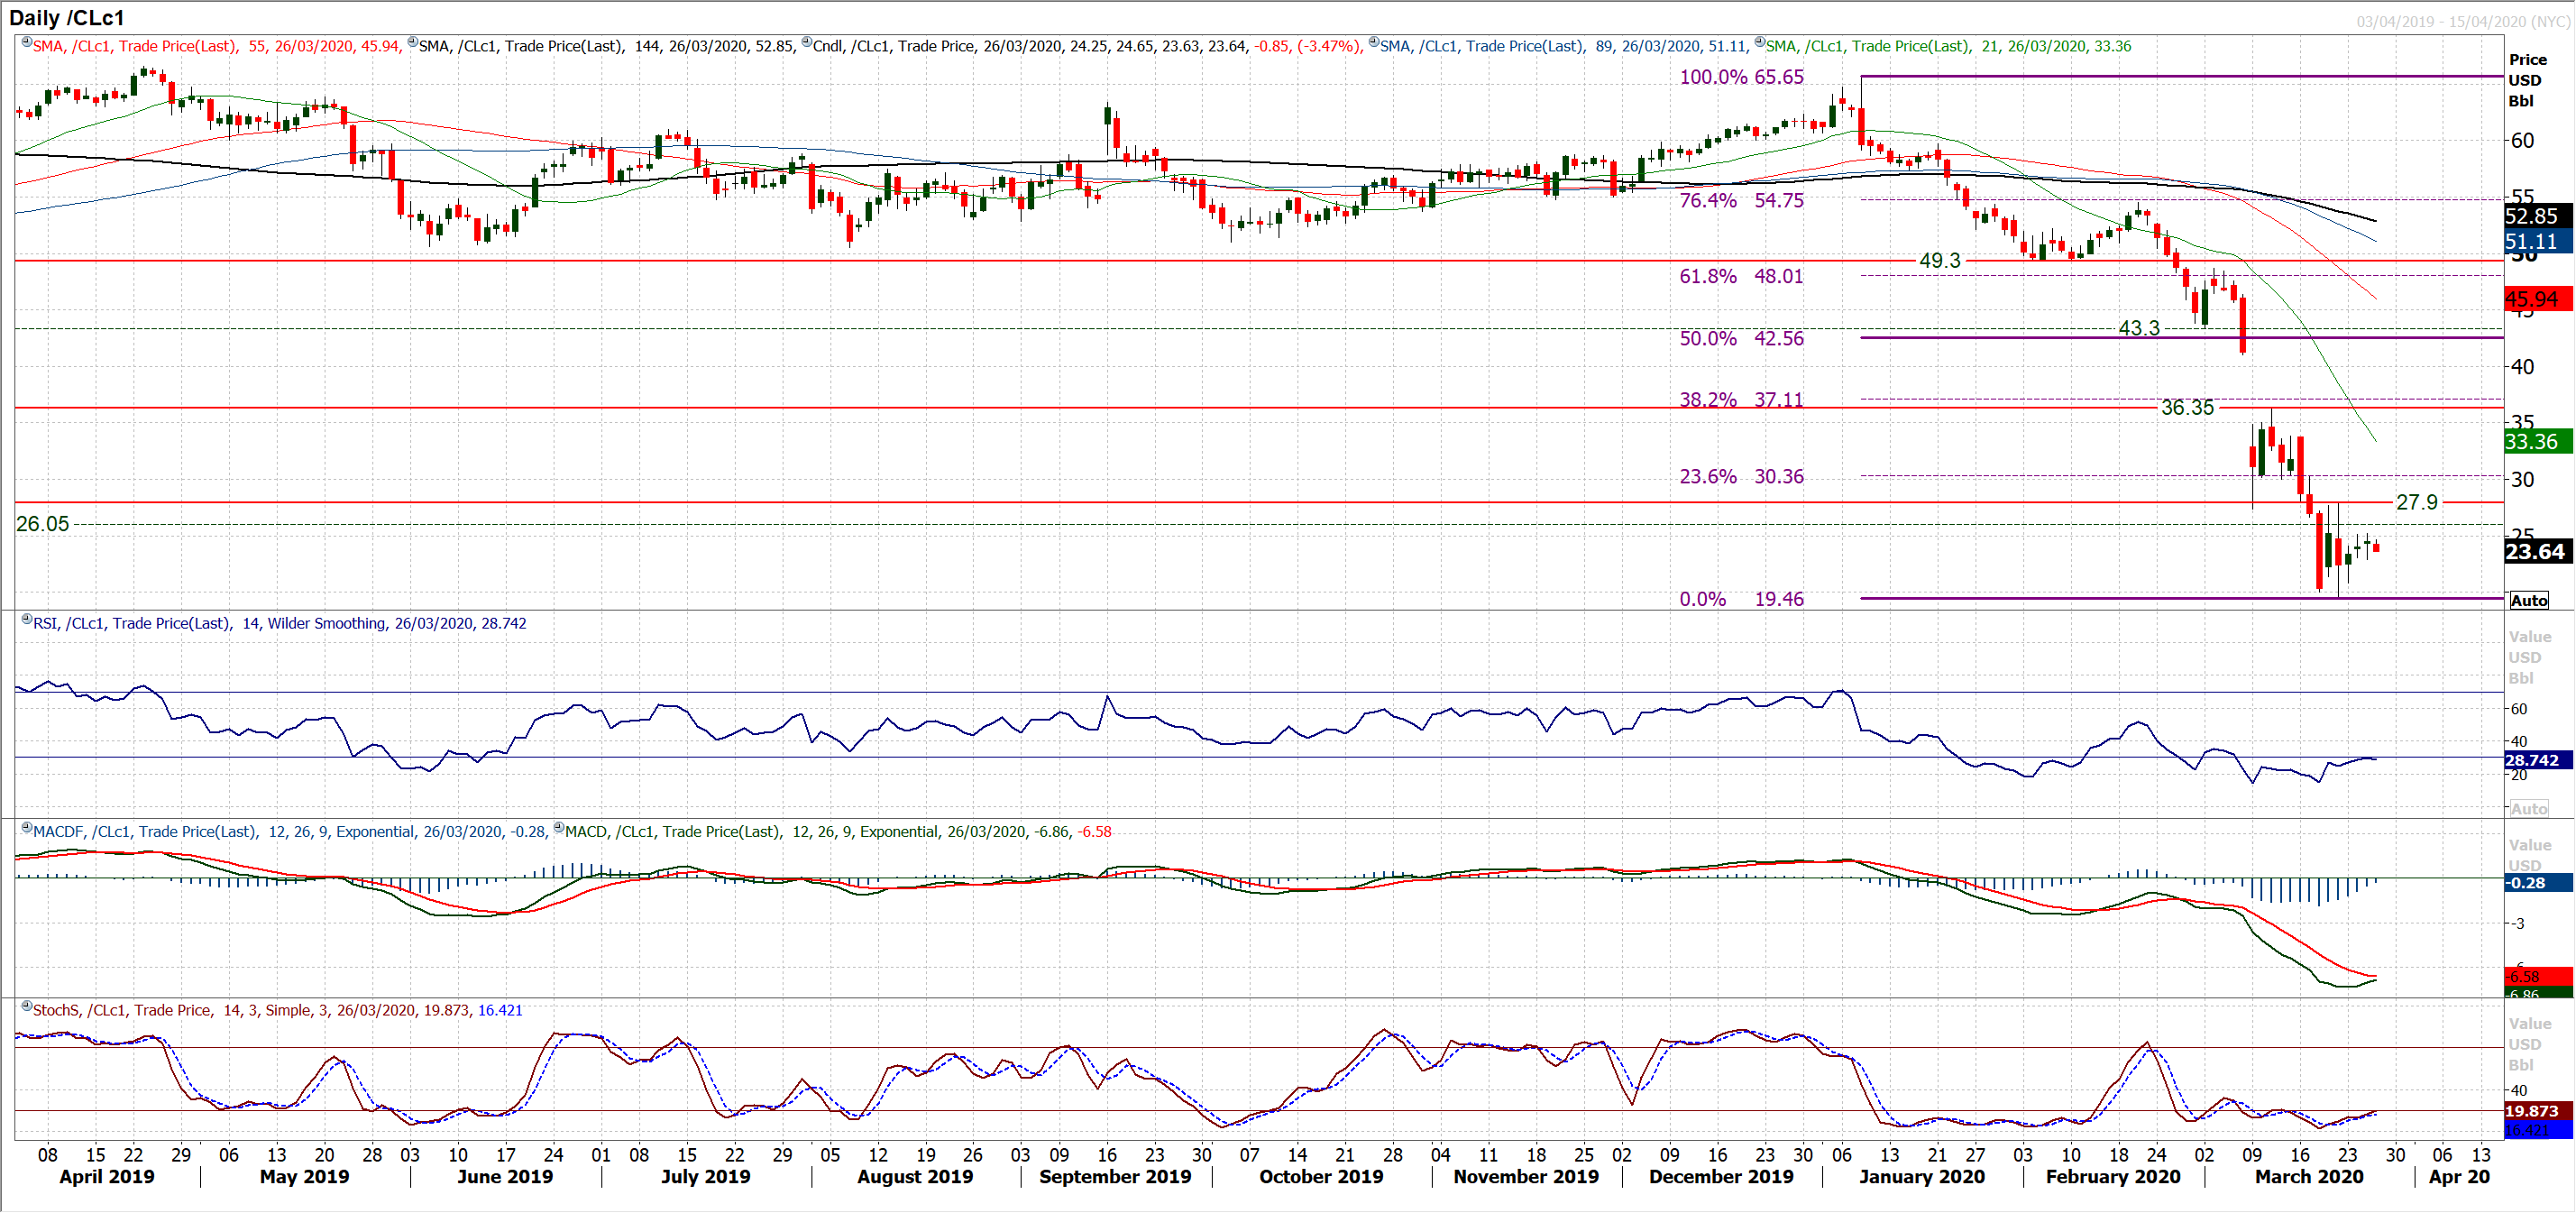
A rare moment of calm. The first thing to say is that oil has stemmed the flow of huge selling pressure. A pick up from $19.45 in the past few sessions has settled the nerves that we might be looking at single digit oil. However, even with three positive closes in a row now, the prospect of recovery is not seemingly going to be “v” shaped. The past few sessions have seen a consolidation develop. This is shown with the reduced daily trading ranges and small candlestick bodies. Hourly technical indicators are moderating, with the hourly RSI between 40/60 for the past few days, hourly MACD settling around neutral and hourly moving averages all converging to flatten together. The rebound has begun to struggle under $25.25 resistance and the bull dream of a breakout above $27.90 to complete a base pattern still seem a long way off. Support around $23.10 needs to hold today to maintain any sense of recovery momentum, whilst the higher low at £21.80 is key to preventing a retest of the $19.45 low.
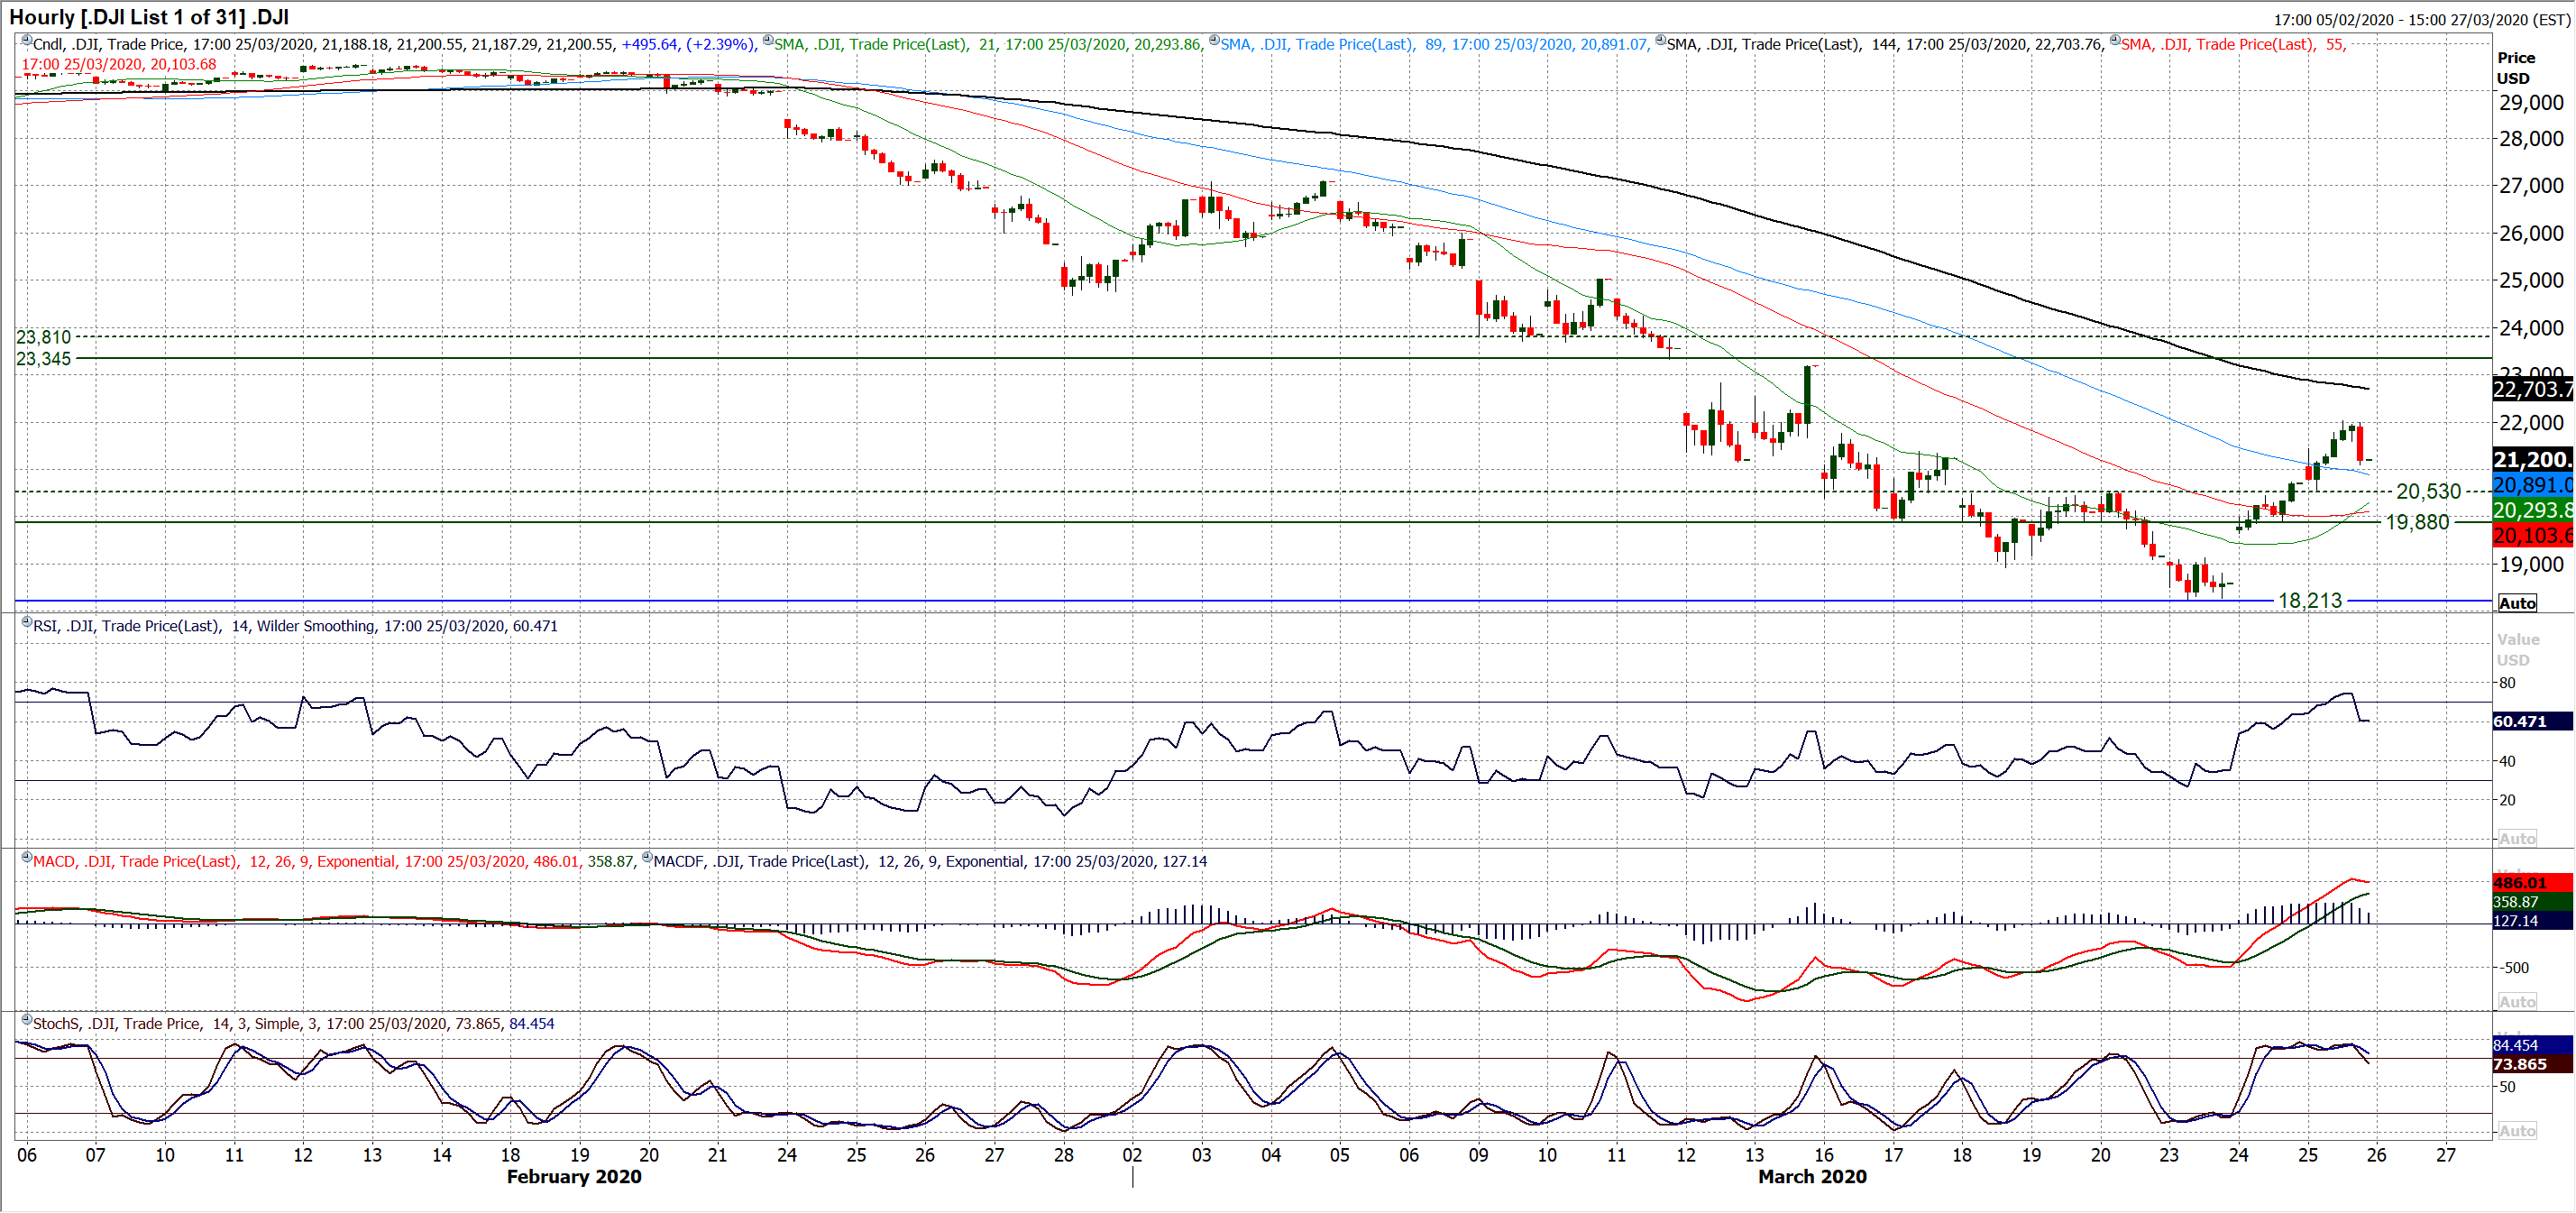
Dow Jones Industrial Average
A second day of gains for the Dow. This is the first time of this happening since the massive sell-off began in mid-February. There will be talk of a sustainable recovery now and perhaps even “the low” having been formed. It is still way too early to say that and how the market responds to the next negative shock/session will be an important gauge. For the Dow, we spoke recently about a breakout above 20,530 which had been a high left on Friday before the culmination sell-off kicked in. It was good to see this 20,530 breakout being used as aa basis of support yesterday. It now means that there is initial support 20,530/20,735. With futures ticking back lower this morning, how this support band reacts will be interesting. Closing back under 20,530 would also be a decisive close back under the 23.6% Fibonacci retracement (of the massive 29,568/18,213 sell-off) at 20,893. It would suggest the bulls losing confidence in the recovery. The hourly chart shows good recovery momentum having built up, so the hourly RSI holding above 40 along with hourly MACD above neutral would be encouraging. A move back under 19,880 would effectively confirm an aborted recovery.
