Market Overview
After a rather lacklustre few sessions, where risk appetite had begun to wane, there has been a boost to sentiment overnight. The plans form Donald Trump over a potential exit strategy for the US has come as welcome news. However, there has also been hope from a Chicago hospital that a potential treatment drug for COVID-19 has been seeing positive results. This came as the scale of the drop in economic activitiy for China was laid bare overnight. China’s growth declined sharply in Q1 with annualised YoY GDP falling by -6.8%, along with a quarter on quarter decline of -9.8%, effectively meeting expectations (6.5% YoY forecast, with -9.9% for QoQ). There was also an interesting mix of March economic data, with China’s Industrial Production for March only down -1.1% (-7.3% exp) whilst China Retail Sales were worse than forecast at -15.8 (-10.0% exp). The suggestion out of China is that the data for March was encouraging. This has all helped to improve risk appetite today. Treasury yields have pulled higher, with the US dollar sliding back across the major forex pairs. The big reaction is coming in equities, where futures are decisively higher coming into the European session. There has been an interesting departure from recent correlations though, with gold (and silver) falling sharply this morning. Gold has played a close positive correlation with equities recently and also been negatively correlated with USD. It seems that gold is suffering on renewed positive risk appetite, is this a return to gold being a safe haven play perhaps?

Wall Street closed mildly higher yesterday with the S&P 500 +0.6% at 2800. The outlook has taken a step forward today, with the E-mini S&P futures +2.8% this morning. This has helped a strong session in Asia (Nikkei +3.1% and Shanghai Composite +0.5%). European markets are also strong in early moves, with FTSE futures +2.3% and DAX futures +2.5%. In forex, we see USD is underperforming major pairs, with AUD and NZD being the main outperformers. In commodities, there is a decline back on gold of -1.0% (although this is off the lows from overnight), whilst silver is -2.4%. Oil is showing a mix of moves, with WTI -2.5% but Brent +2.2%.
It is a relatively quiet end to the week for the economic calendar. The final reading of Eurozone March inflation is at 1000BST and is expected to confirm that Eurozone headline HICP fell to +0.7% (+0.7% March prelim, +1.2% Feb final). Eurozone core HICP is expected to be 1.0% (+1.0% March prelim, +1.2% Feb final).
Chart of the Day – DAX
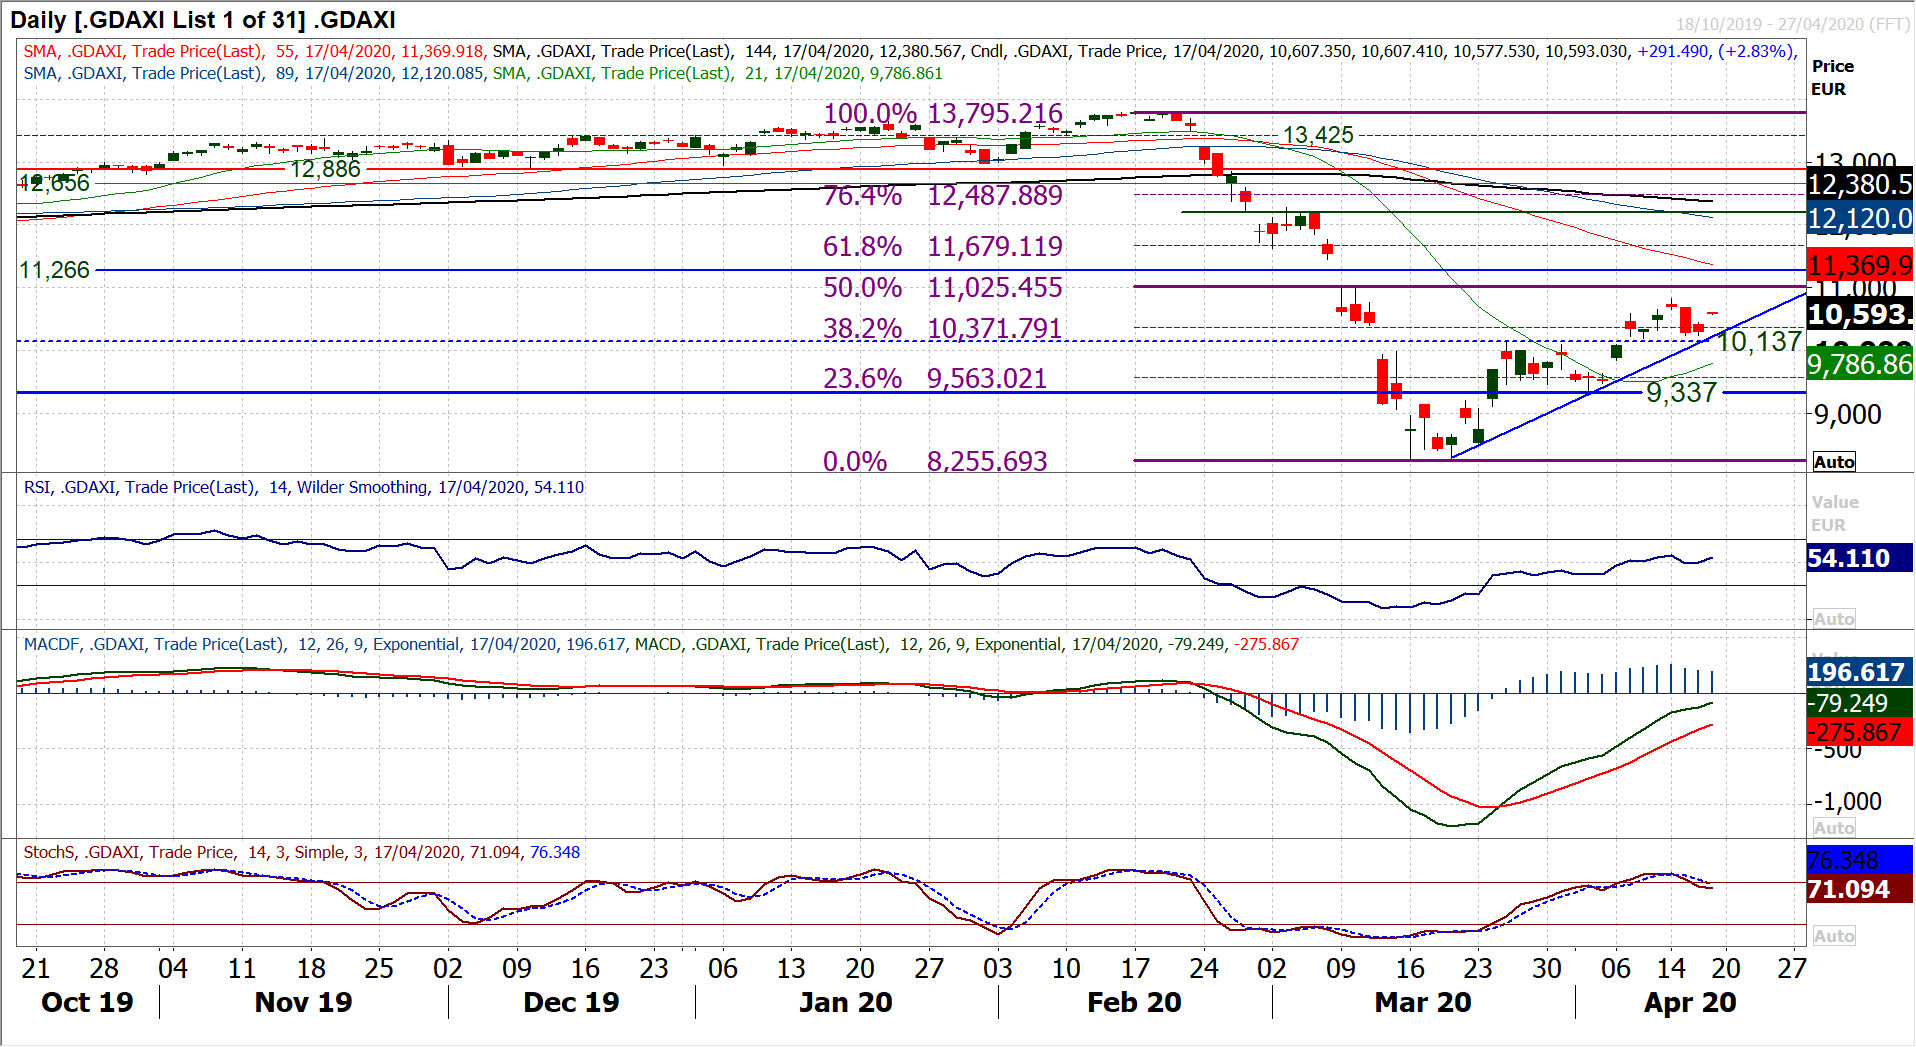
In recent days we have been looking increasingly into charts which show the risk of potential for reversal patterns. The DAX rally has been questionable with a series of three successive negative candlesticks (with closing price below the open), suggesting a lack of conviction developing in the bull run. Primarily, the concern has become whether the bulls can hold the breakout above the first key reaction high, at 10,137. There is also the uptrend which has formed in the past four weeks, which comes in at 10,225 today. The positive run on momentum is also beginning to falter, with RSI turning lower and Stochastics having bear crossed lower being most pertinent. How the bulls now respond this morning to the early rebound could be key now. A retreat to the uptrend followed by a decisive bull candle could see the next leg take off to new multi week highs (above 10,820). However, if we see a bull failure today and the rebound fizzles out again, it would suggest that there is a continued lack of conviction in the bulls and the key breakout at 10,137 will comes back into focus in the coming sessions. The hourly chart shows that momentum has unwound and hourly RSI back above 60 would be a positive signal again. The bulls will also point to the late March consolidation which threatened a top before an upside break. Subsequently, it is important not to run ahead of downside break confirmation. However, the market which looked well set in its recovery is no looking increasingly unsure. A close above 10,500 would improve the outlook today and above 10,820 is again breakout.
EUR/USD
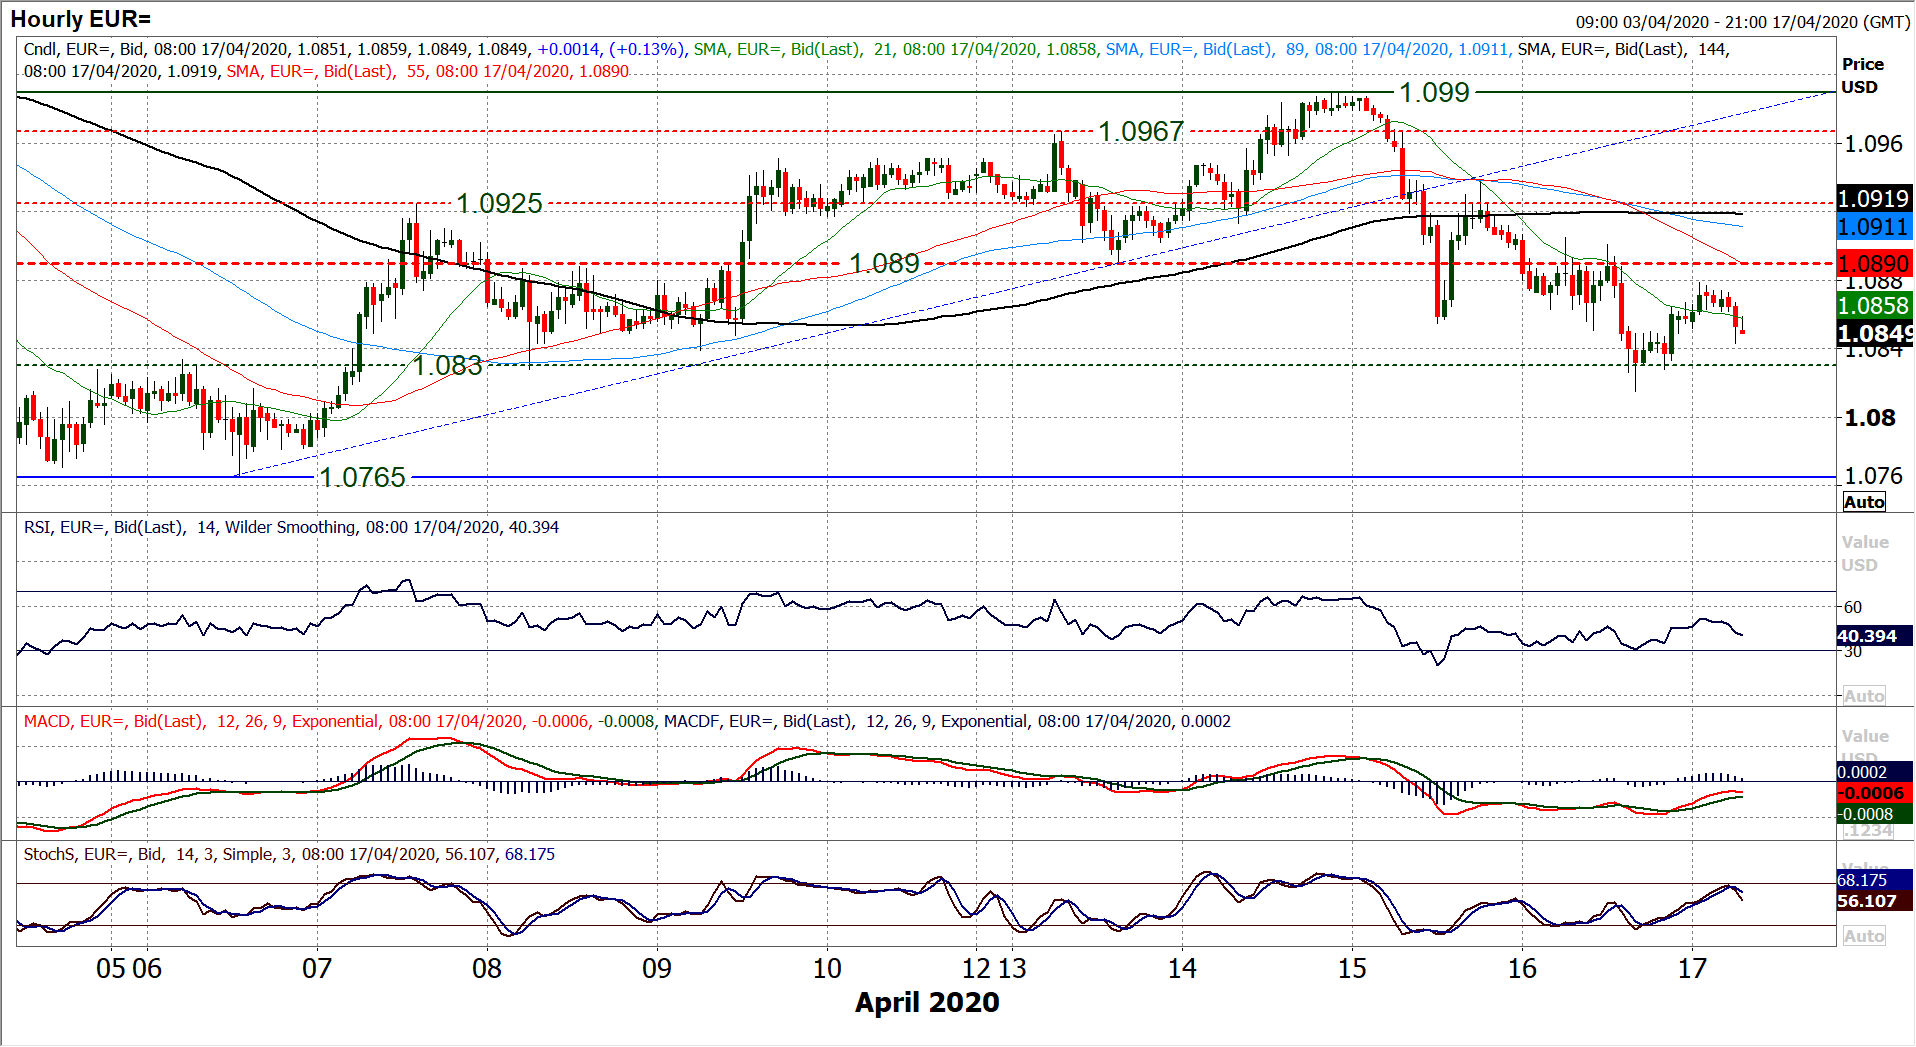
We have been noting the increasingly corrective configuration developing on EUR/USD in the past couple of sessions. This took a step forward yesterday as a decisive break of the three week uptrend confirmed with a second consecutive bearish candle. We are now seeing lower highs and lower lows form as the dollar has begun to strengthen. This is reflected in the negative bias developing on daily momentum indicators, something that is also present on the hourly chart. Breaking the old uptrend and using the underside as a basis of resistance, the old pivot band between $1.0890/$1.0925 has become a basis of resistance. Rallies are now a chance to sell, and so reaction to this morning’s rebound will be key. A rally off yesterday’s low at $1.0815 is back towards the $1.0890 resistance area again. So, if the dollar bulls are now in the ascendancy this will be a barrier and a likely area for another lower high. With both daily and hourly momentum showing negative configuration now, we prefer to use rallies as a chance to sell. A decisive move clear below $1.0830 would open a test of support of the early April low around $1.0770.
GBP/USD
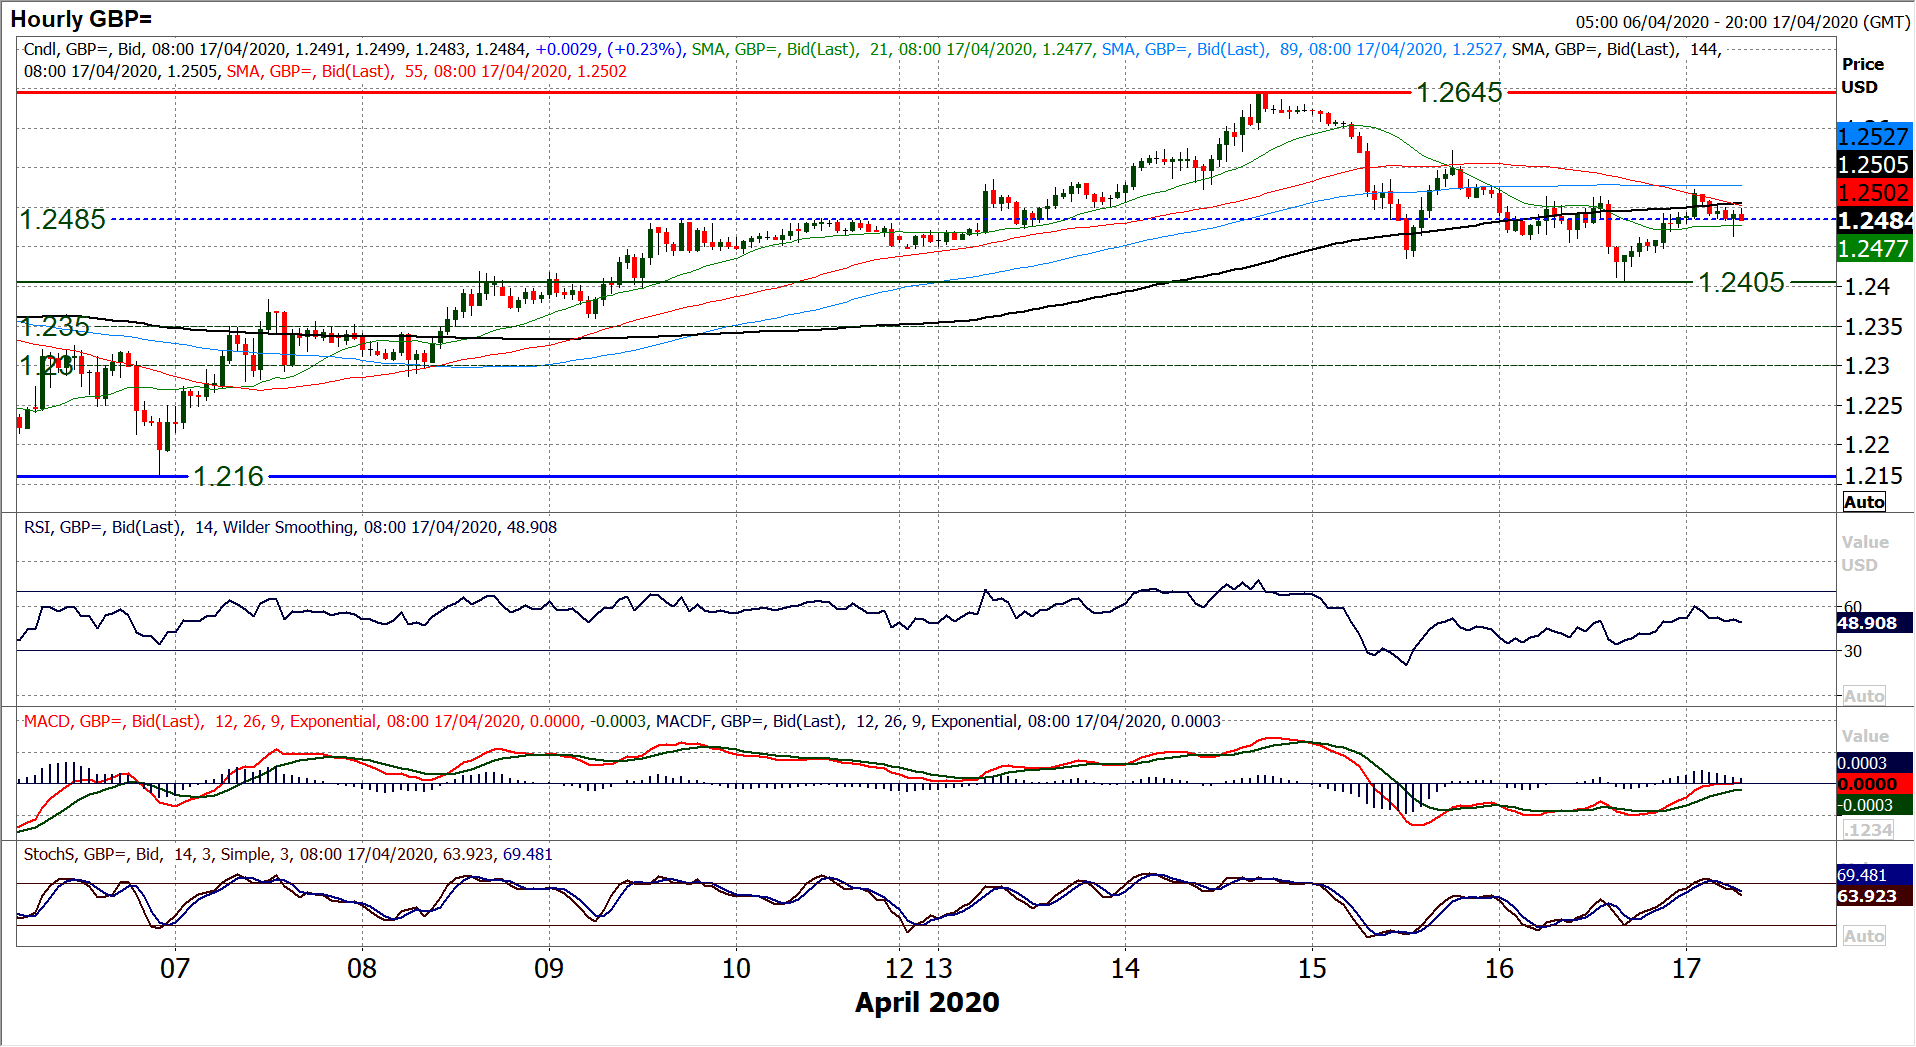
Cable has been sitting at a crossroads for much of the time in recent sessions, but yesterday’s second consecutive negative candle suggests the dollar strength is threatening to resume. However, the early reaction higher today suggests that the Cable bulls are still in for the fight. Momentum still sits around key turning point areas, with special attention on the bear cross on Stochastics. It would suggest that a failure o9.f the early rebound today would bolster the view that a renewed deterioration in the outlook for Cable was growing. The hourly chart is at best neutral now, but the emergence of lower highs and lower lows in the past few sessions is a concern. It means that the bulls need to overcome $1.2570 to regain control. Hourly momentum is fairly neutrally configured now and the market is still buzzing around the $1.2485 previous key breakout (which is a near term gauge). A failure today and retreat to breach support at $1.2405 would really put the stamp of dollar strength back on Cable.
USD/JPY
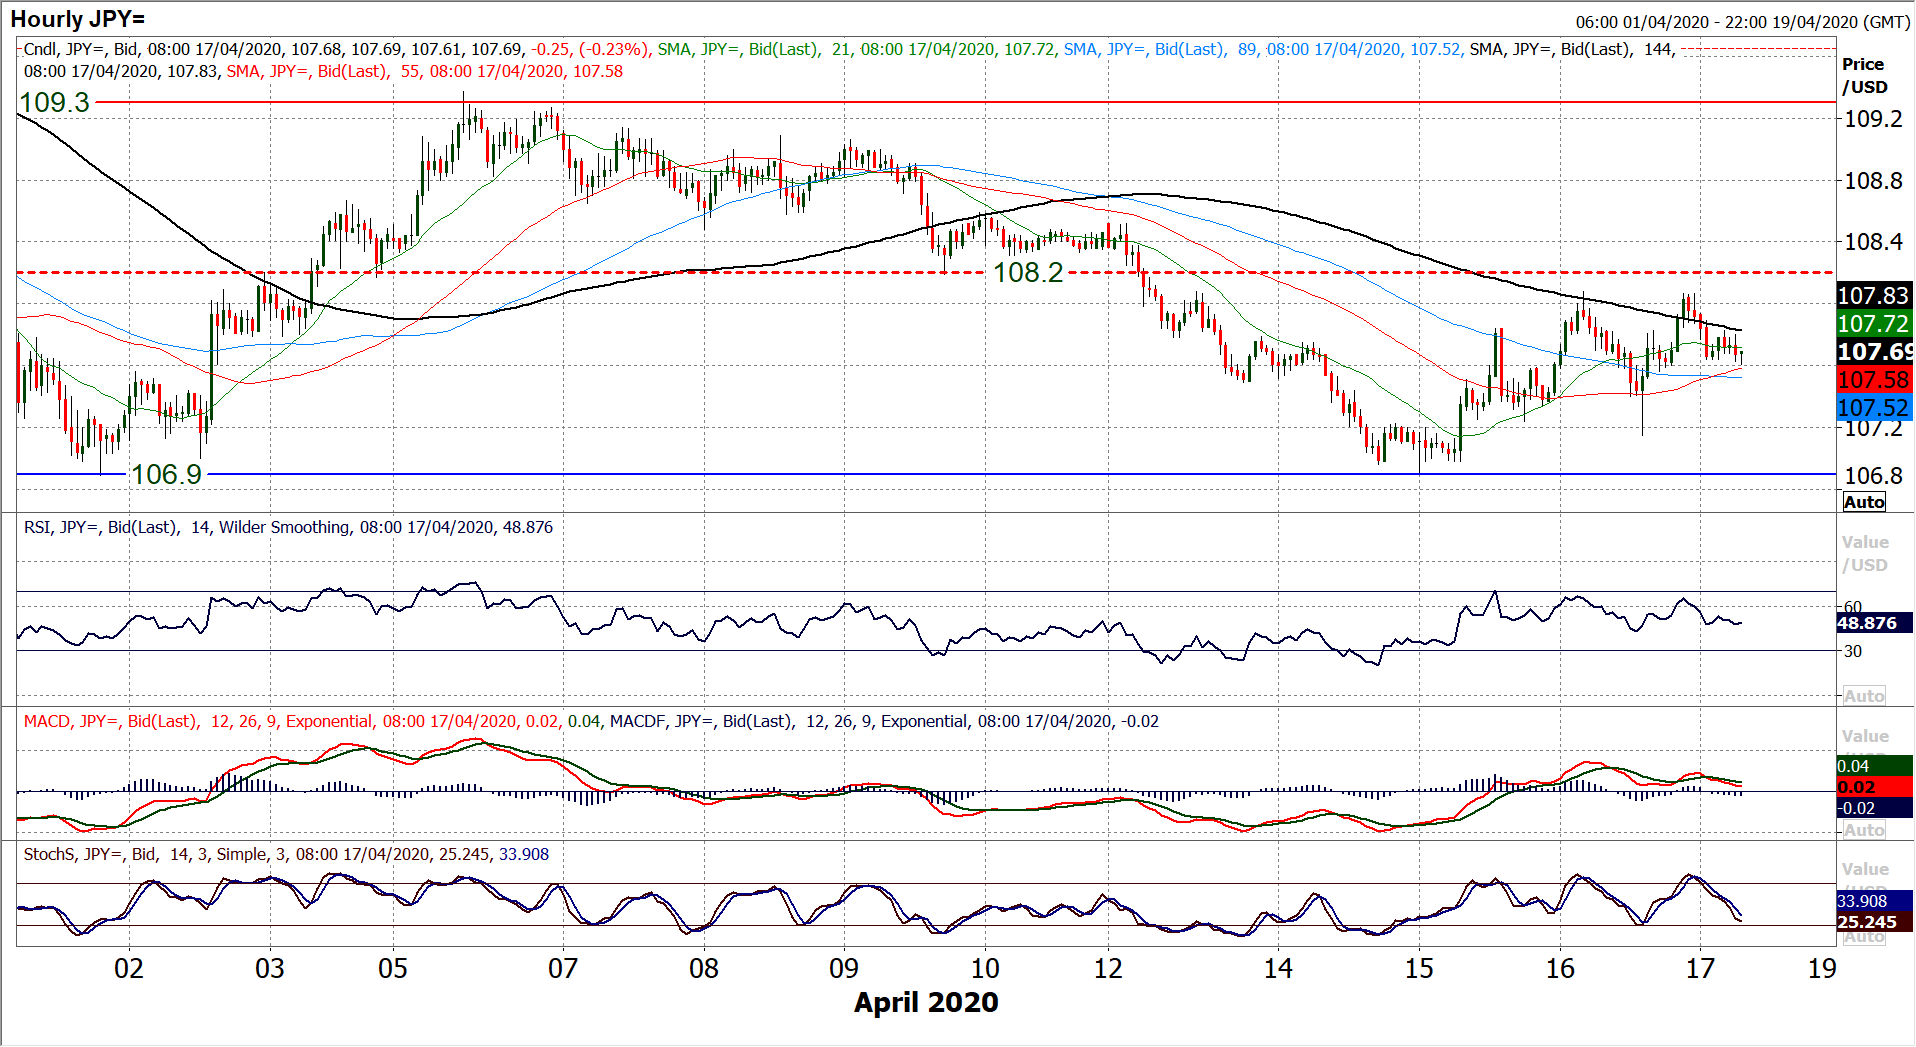
We continue to see a near term uncertainty with the outlook on Dollar/Yen. Two positive candles may have just bolstered the support at 106.90 but the rally seems to be struggling around the near term resistance band 108.00/108.20. The formation of an early negative candle on the daily chart today suggests that the bulls are stalling again. Momentum on the daily chart has stabilised recently and there is an increasingly neutral look to RSI and MACD, whilst Stochastics are seeing their negative configuration at least negated. Reaction around the 61.8% Fibonacci retracement (of 112.20/101.20) at 108.00 will be seen as a gauge, whilst a mini downtrend of the past week and a half is still holding. We recently shifted our view on Dollar/Yen to a more neutral outlook (between 106.90/109.30) whilst there is a minor negative bias within the range whilst trading under 108.00/108.20. This outlook still holds this morning.
Gold
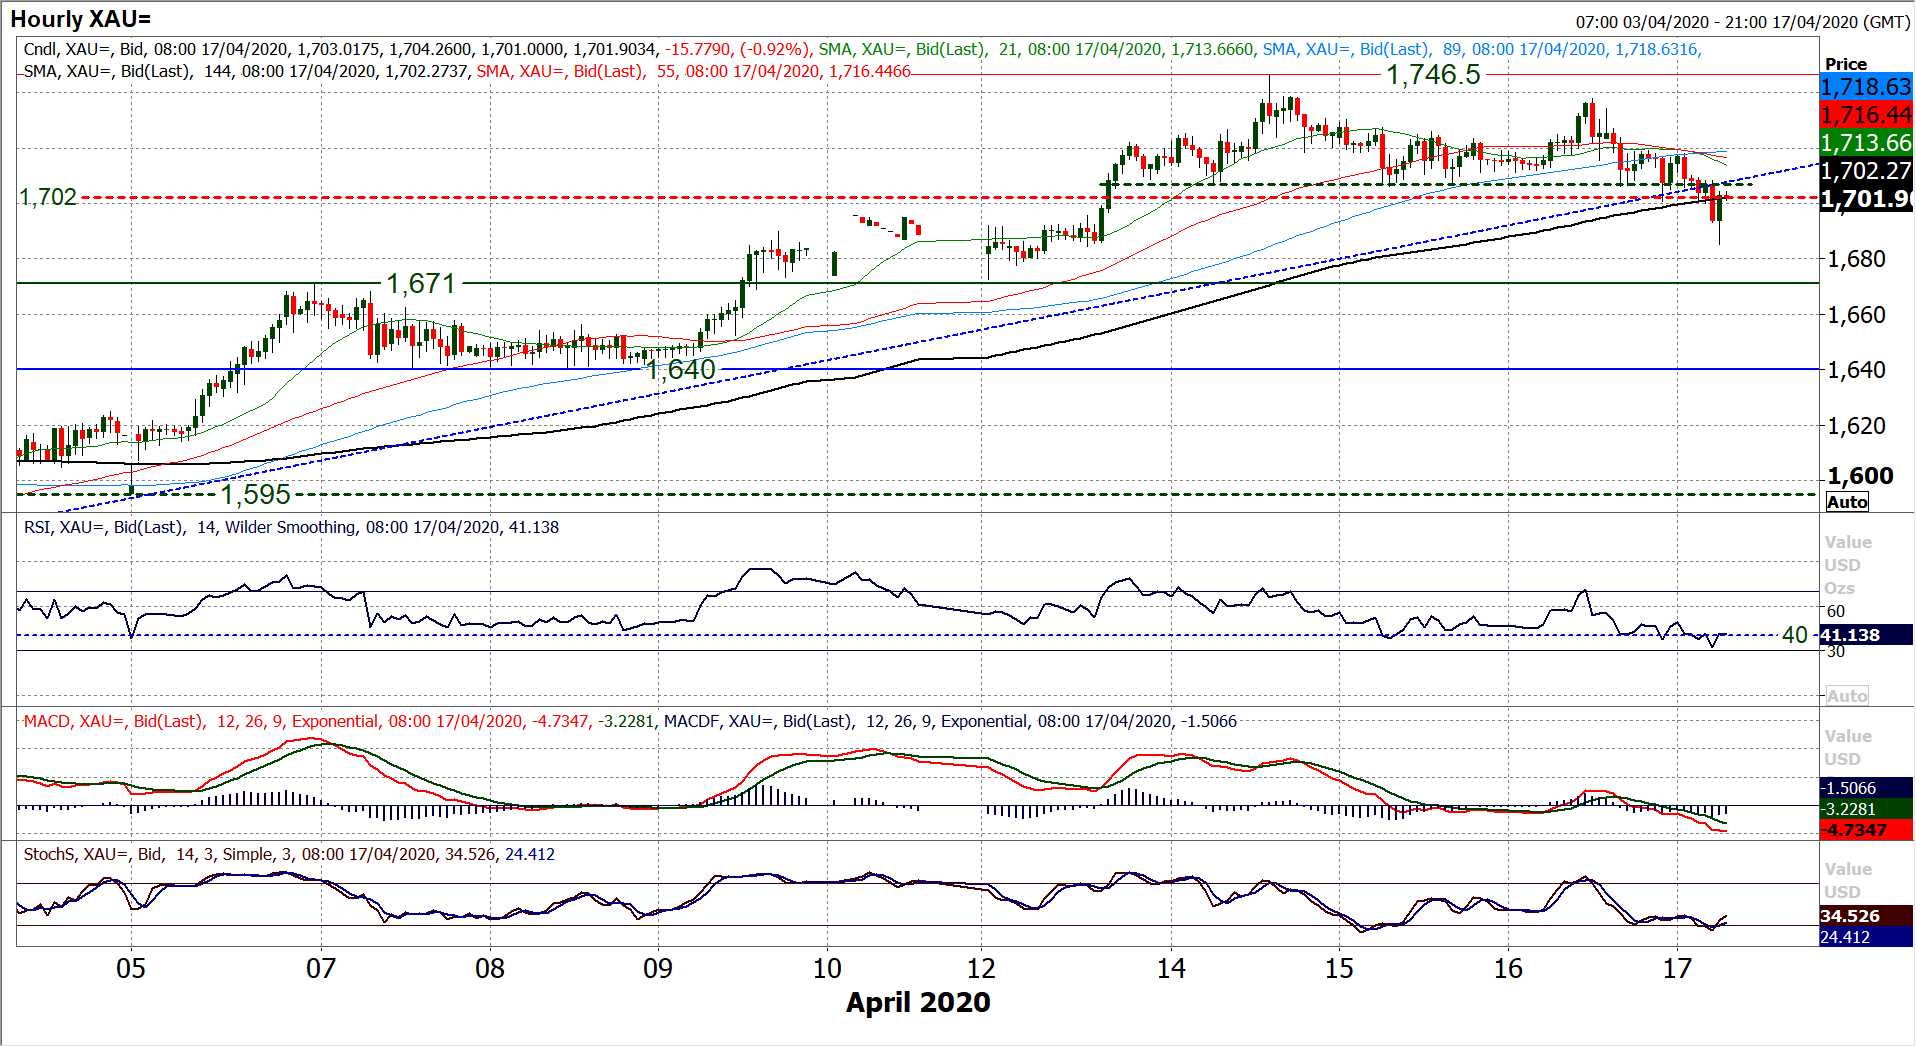
We have become increasingly cautious of the breakout on gold in recent sessions, and this morning we have seen our concerns play out. A decisive downside break of not only near term support at $1706 but the breakout support of $1702 and the four week uptrend has occurred. Although not yet with a closing breach of support at $1702, the decisive downside break early today suggests a key break of the support and a near term shift in outlook. It comes with Stochastics crossing lower and RSI pulling back again. The hourly chart shows the near term top pattern has now completed and implies a retreat towards $1676. Furthermore, we see hourly momentum turning corrective, with hourly RSI moving below 30 (when 40 was previously seen as supportive), whilst hourly MACD lines are also deteriorating below neutral. We continue to believe that near term weakness on gold will simply be another opportunity to add to medium term long positions. We see this move playing out as another such opportunity. However, for now, gold is in retreat. There is good support around the old breakouts of $1642 and more recently $1671. However, given the continued positive medium to longer term outlook, it is a time for caution on gold. However, we look for supported buy signals for the next chance to go long. Holding support at $1671 would be a positive signal now.
WTI Oil
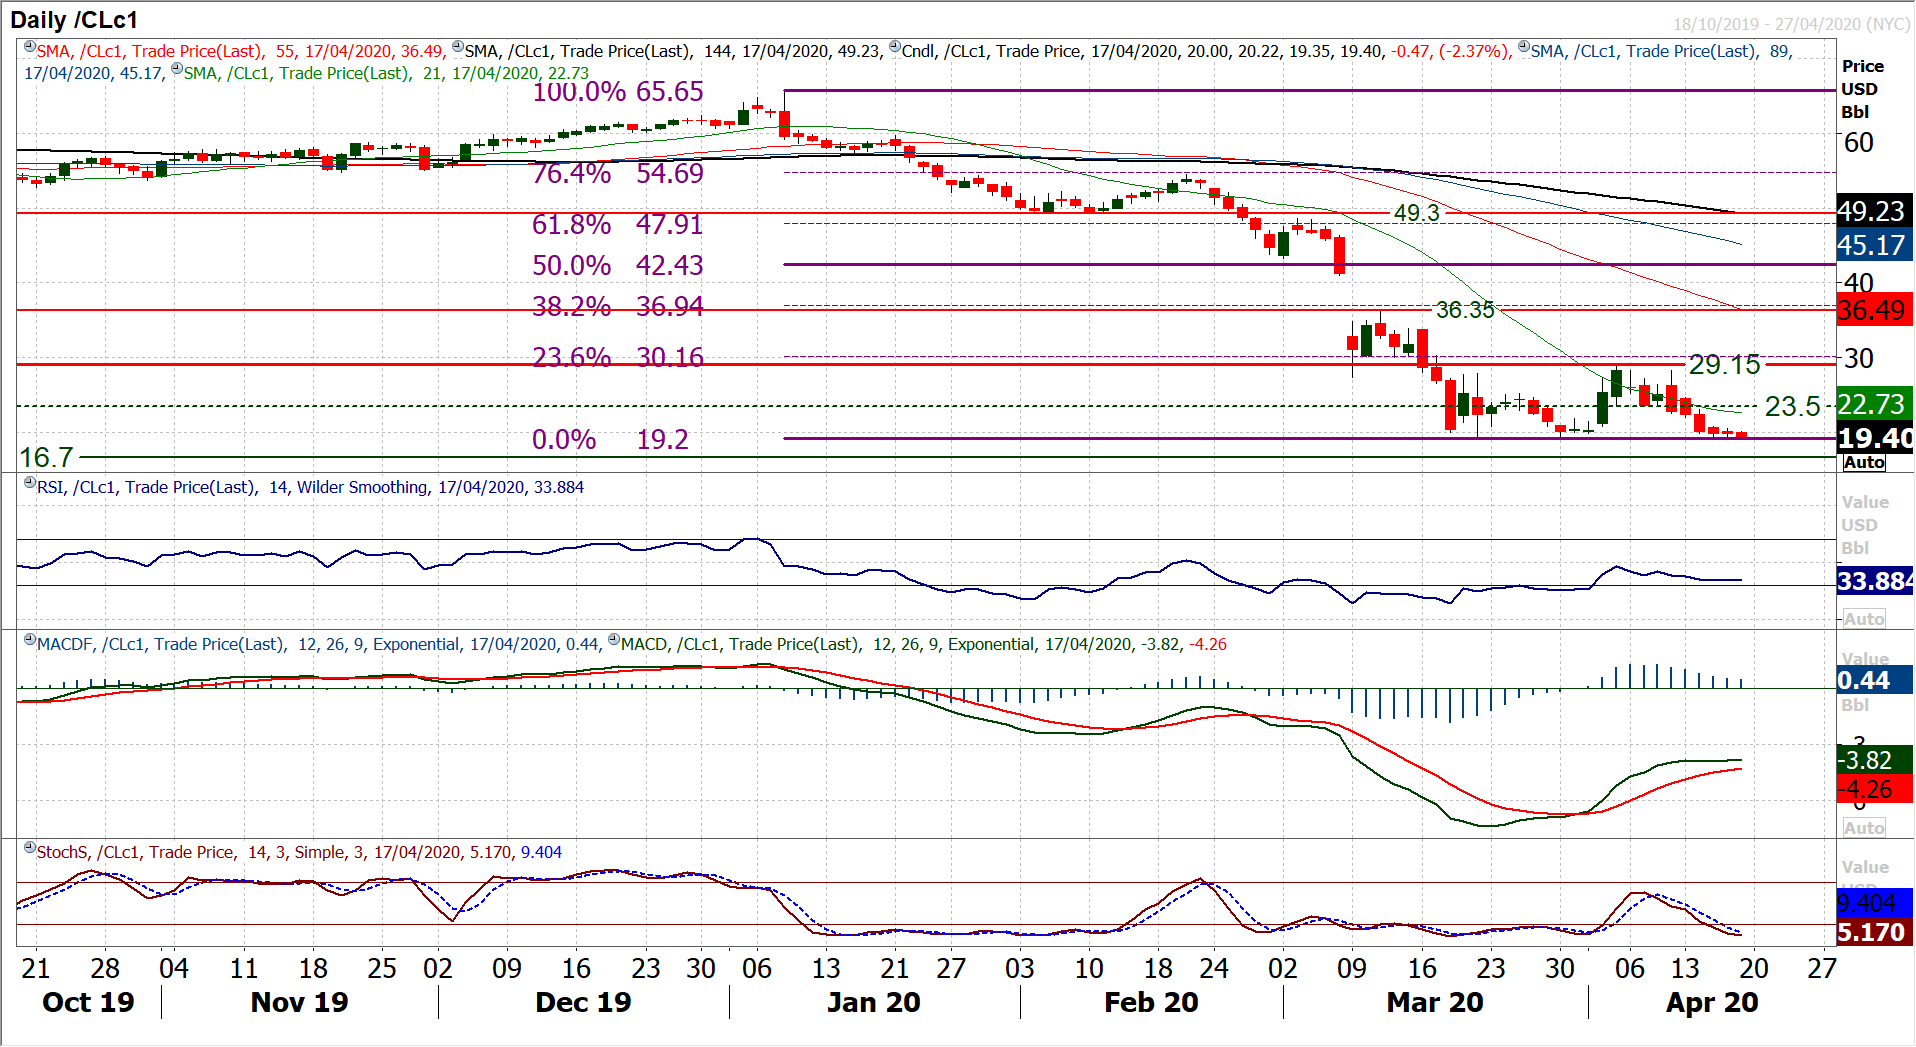
It is interesting to see that the support of the bottom of the range continues to hold. Although a new multi-year low was reached (only by a hair’s breadth) at $19.20 earlier in the week, this level continues to hold. What is more remarkable is that the magnitude of the bear candles has significantly reduced. There is an almost calm that has taken over. The daily chart shows that bear candles are still the norm, but with a lack of real selling intent. The bulls will be looking at the resistance of $20.60 on the hourly chart (Wednesday’s intraday high) as a near term gauge for potential recovery now. A decisive breach would complete a small base pattern and imply $22.00. A similar run of small bodied candles (lacking conviction) was seen at the end of March, before a rebound set in. That bound was driven by comments on production cuts from Trump, something that is now in the price, so it is difficult to see what may drive the price higher this time. However, for now the support around $19.20 is holding firm and daily momentum indicators are relatively settled. The risk still has to be a downside break of $19.20 which opens multi-year lows, but for now it is a waiting game.
Dow Jones Industrial Average
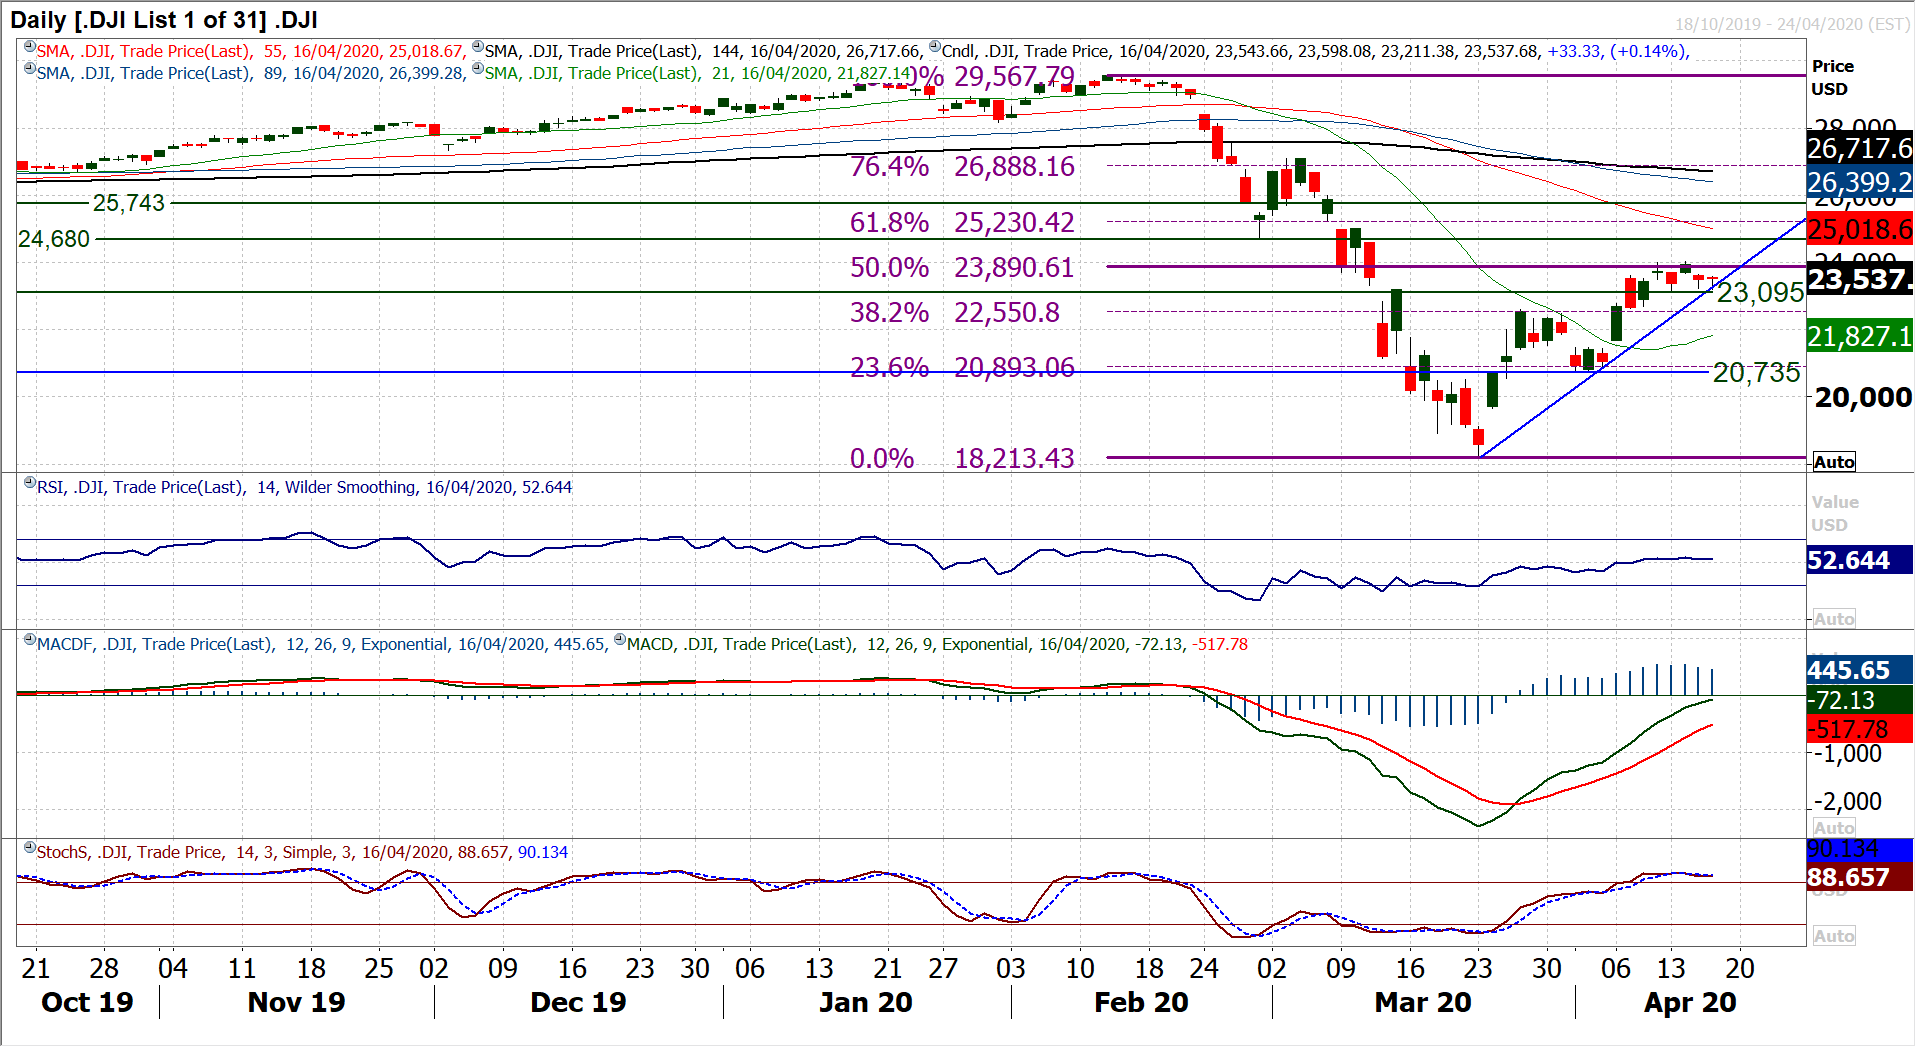
As the early April breakout has begun to lose impetus in recent sessions, thoughts have turned to whether this is another key turning point. With 50% Fibonacci retracement (of 29,567/18,213) providing a basis of resistance around 23,890 the emergence of a number of rather more corrective candles in recent sessions have threatened the market to roll over. The first real test of the recovery, the near four week uptrend, was seen yesterday and the bulls held firm. Another small bodied candle with a long downside tail suggests the sellers are testing the resolve of the bulls. So far the bulls are standing firm, and are looking decent in early moves today. Maintaining the uptrend and what is now set for a positive session today is a good response that suggests they are not quite ready to given up their position of control. Reaction around the 50% Fib of 23,890 is the early gauge, as is the resistance of Tuesday’s high at 24,040. A close clear above this resistance with a strong bull candle would be a very encouraging response today. It would leave 23,095 as anther key higher low and opens the next resistance at 24,680 along with the next potential consolidation area of the 61.8% Fib retracement at 25,230.
