Market Overview
There have been several false dawns of recovery in the past couple of weeks and once more as European traders sit at their (home) desks this will be the issue they face. After gargantuan selling pressure yesterday (yes we are going through the Thesaurus now), there is another rebound this morning. Could there even be a sense of calm developing as the European session kicks in? Treasury yields are ticking higher, equities are looking at a respite rally and oil has rebounded. After the major central banks coordinated response and massive Fed easing, government are increasingly facing the requirement for a fiscal response. France for one has stepped up with €300bn of support. Other major economies need to follow suit, with ways to support businesses and individuals as demand and supply both fall off a cliff over the coming weeks. Perhaps if this were seen then it would be a sustainable turning point? This morning we see the US dollar regaining some of its strength once more, but for now it seems relatively more orderly at least. The Federal Reserve and other major central banks looking to unclog overnight funding on money markets will at least help to reduce the credit problems. So, a more orderly forex outlook would be reflective of this. The dollar should remain preferred at this time of uncertainty, but a sense of normality can also begin to breed confidence once more.

Wall Street felt massive selling pressure with the S&P 500 -12% at 2386, but US futures are at least showing a sense of recovery today, currently 3.8% higher. Asian markets were mixed overnight (Nikkei +0.1%, Shanghai Composite -0.3%), but European markets are looking more positive on futures, with FTSE futures +3.2% and DAX futures +3.1%. In forex, there is a renewed strength to USD today, especially with JPY underperformance. AUD is also slipping back after the RBA minutes. In commodities, the sell-off in gold continues, with another -1.9% today, but at least silver is moderating its decline (relatively) only -1.8% lower. Oil has rebounded today and is around +5% higher.
There is a range of UK, Eurozone and US data across the economic calendar today. The UK employment data for January is at 0930GMT with UK Unemployment expected to remain at 3.8% (3.8% in December) whilst UK Average Weekly Earnings are expected to have increased marginally to +3.0% (from +2.9% in December). The outlook for the Eurozone’s largest economic in March will be reflected at 1000GMT, with the German ZEW Economic Sentiment which expected to deteriorate sharply to -26.4 (from +8.7 in February). The ZEW Current Conditions component is expected to drop to -30.0 (from -15.7 in February). On to US data, US Retail Sales are at 1230GMT and are expected to show a monthly growth of +0.2% in adjusted Retail Sales (ex-autos) after +0.3% growth in January. US Industrial Production is at 1315GMT and are expected to improve by +0.4% in February (after a reduction of -0.3% in January). US JOLTS jobs openings at 1400GMT are expected to have increased to 6.47m in January (from 6.42m in December).
Once more, there are no central bankers due slated to speak today, and FOMC members remain in their blackout period until Wednesday’s FOMC announcement.
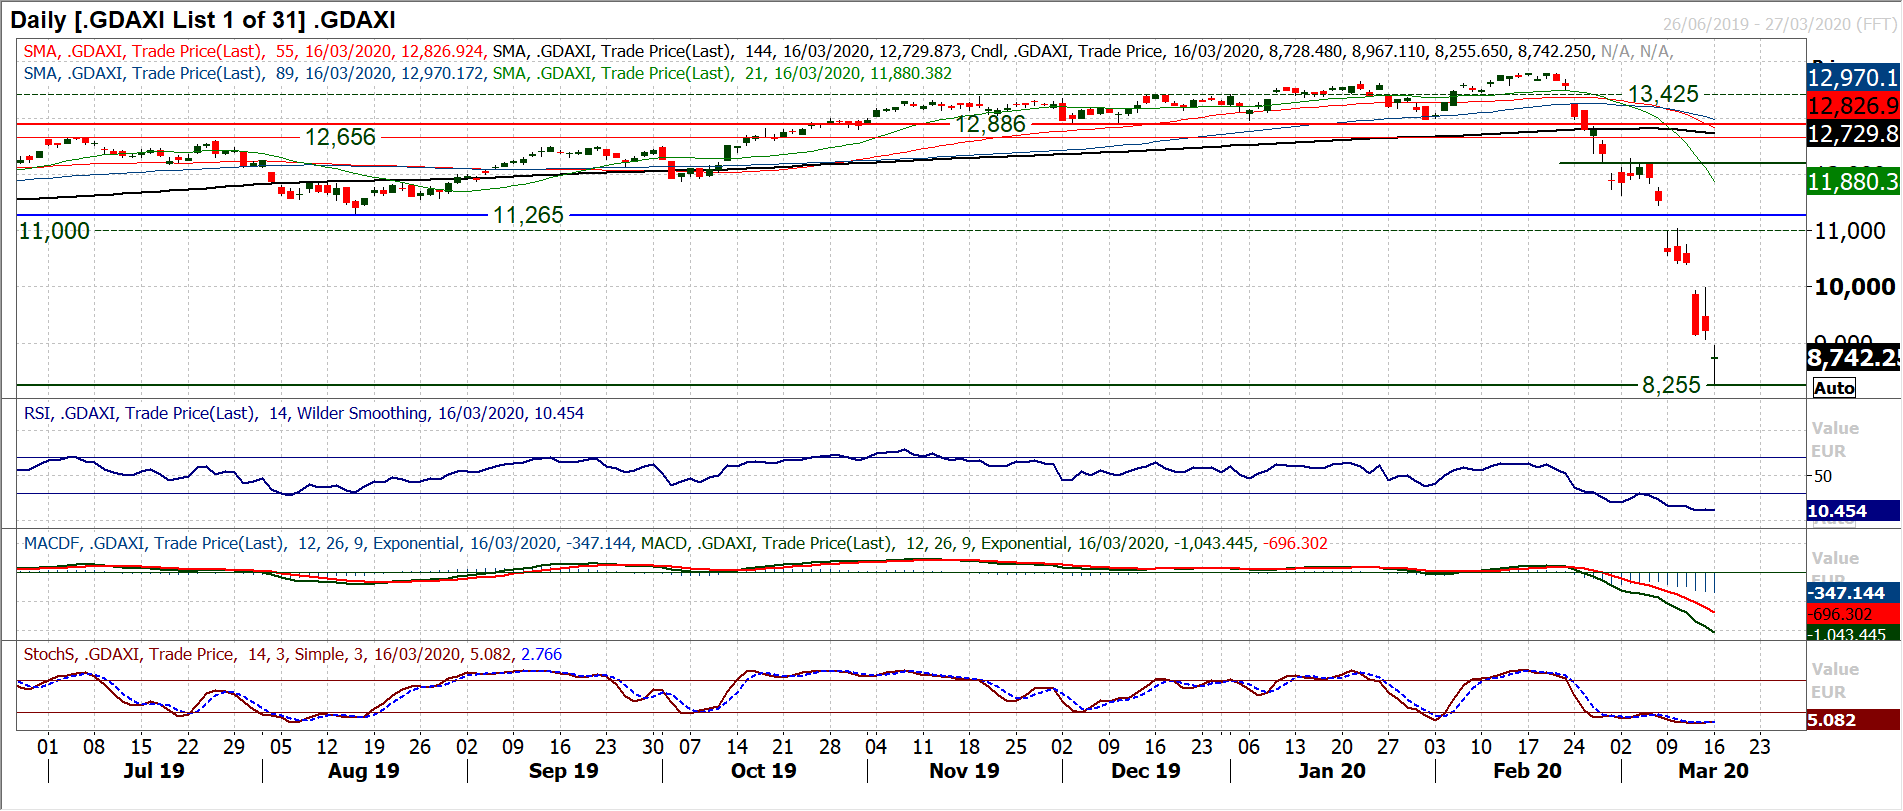
Chart of the Day – German DAX
The technical analysis on major equity indices has been considerably damaged in recent weeks to such an extent that historic support levels have been rendered almost meaningless. The number of downside gaps left unfilled on the DAX in the past three weeks is incredible. Throughout the run lower, there have been as many as five gaps left unfilled. The moves lower have continued, but given the precipitous sell-off and subsequent stretched momentum, the potential for a technical rally is elevated. The move will still likely be a news-driven event, but we can also look out for technical signals of a rally brewing. Monday’s significant intraday rebound off 8255 ended with a close that was pretty much a doji candlestick (which denotes uncertainty with the underlying trend). With today’s session looking for a (relatively) small initial rebound, the prospect of recovery will be posed. The latest downside gap is open at 9065. Initially this needs to be “filled” (something that has not been seen in the previous three gaps), but if it can be “closed” then the prospects of a more considerable bounce increase. Only one of the five gaps have been filled and as yet none have been closed. So if this can be changed then it could be a sign of growing recovery potential (even if it is near term for now). The hourly chart shows a move above 45 on hourly RSI can also be a signal (above 55 would be a confirmation signal of at least a near term rebound). As things stand there is still little to suggest yesterday’s low at 8255 will not be retested, and we retain the view that intraday rallies will be sold into.
EUR/USD
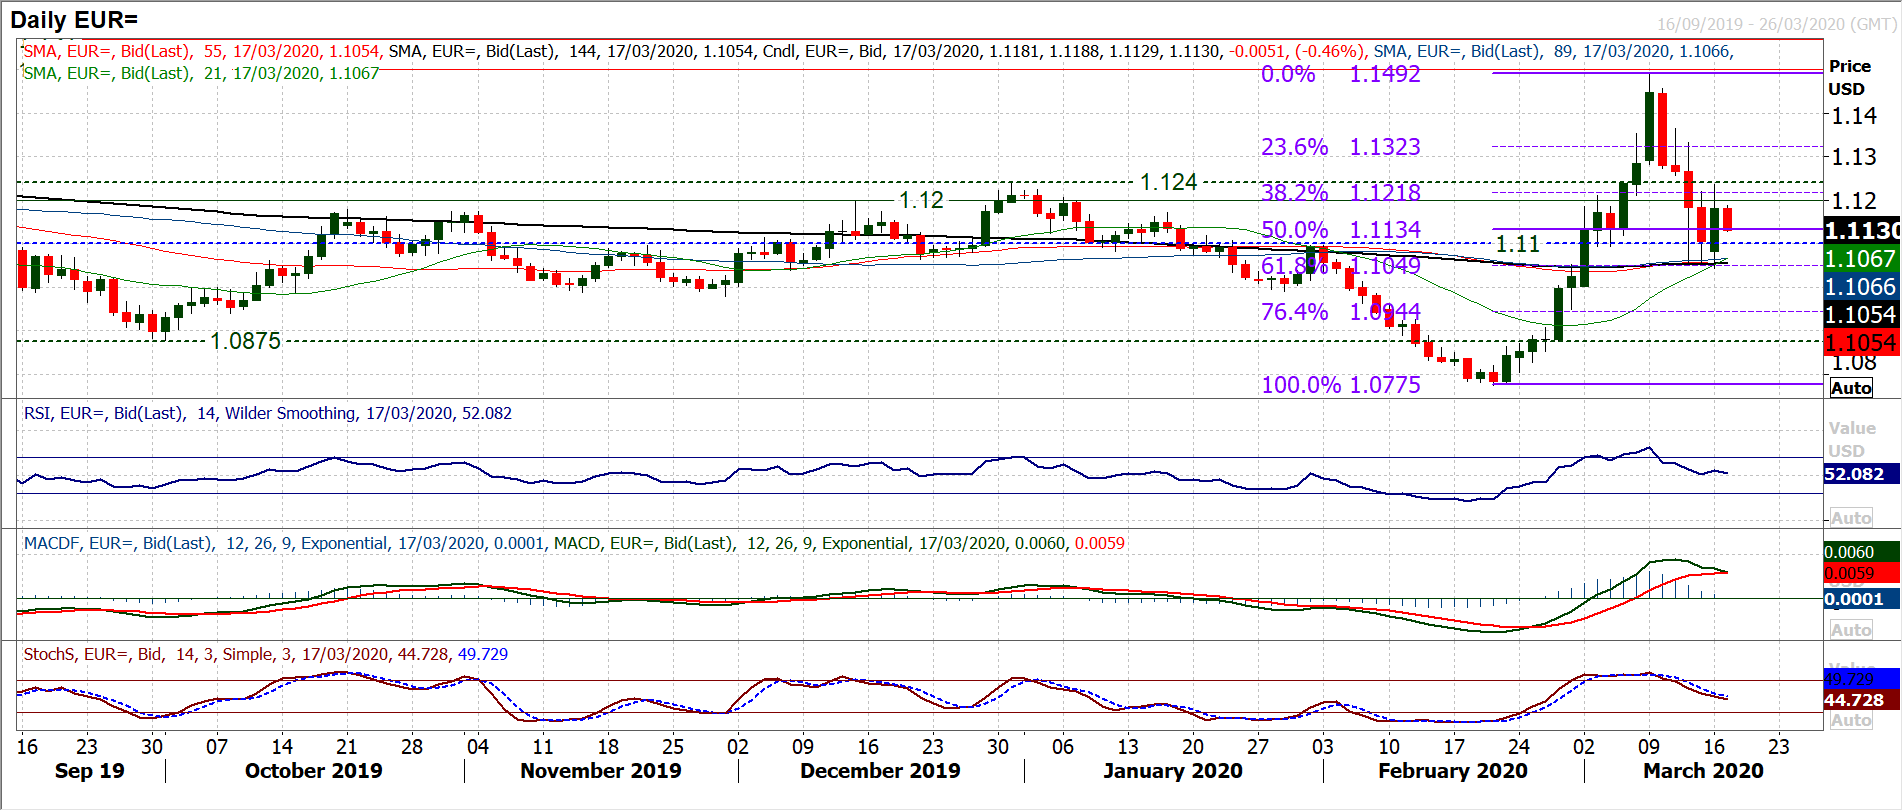
The emergency easing response from the Fed and the coordinated measures through major central banks should rein in the dollar strength. This seemed to impact more positively on EUR/USD than on other pairs. At least the EUR/USD bulls were able to stem the tide initially. A decisive positive candle has seen support develop around $1.1050 which is also around the 61.8% Fibonacci retracement (of the $1.0775/$1.1492 bull run). It also interestingly has helped to settle the swings on momentum, with the Stochastics and RSI moderating around their neutral points and MACD also flattening off. Effectively, the move appears to (for now at least) settled the market around a neutral area between the 38.2% Fib (at $1.1220) and the 61.8% Fib (at $1.1050). We have previously been talking about the resistance at $1.1200/$1.1240, whilst now there is also support building around $1.1050 (also around a clutch of fairly flat moving averages) and $1.1100 (an old pivot). Outside these supports and resistances gives some directional signals for the extremes of the range again. This morning we see the market relatively calm. If the dust can settle then we can give a more refined appraisal, and return to some sort of normality. Holding initial support at $1.1095 this morning will help.
GBP/USD
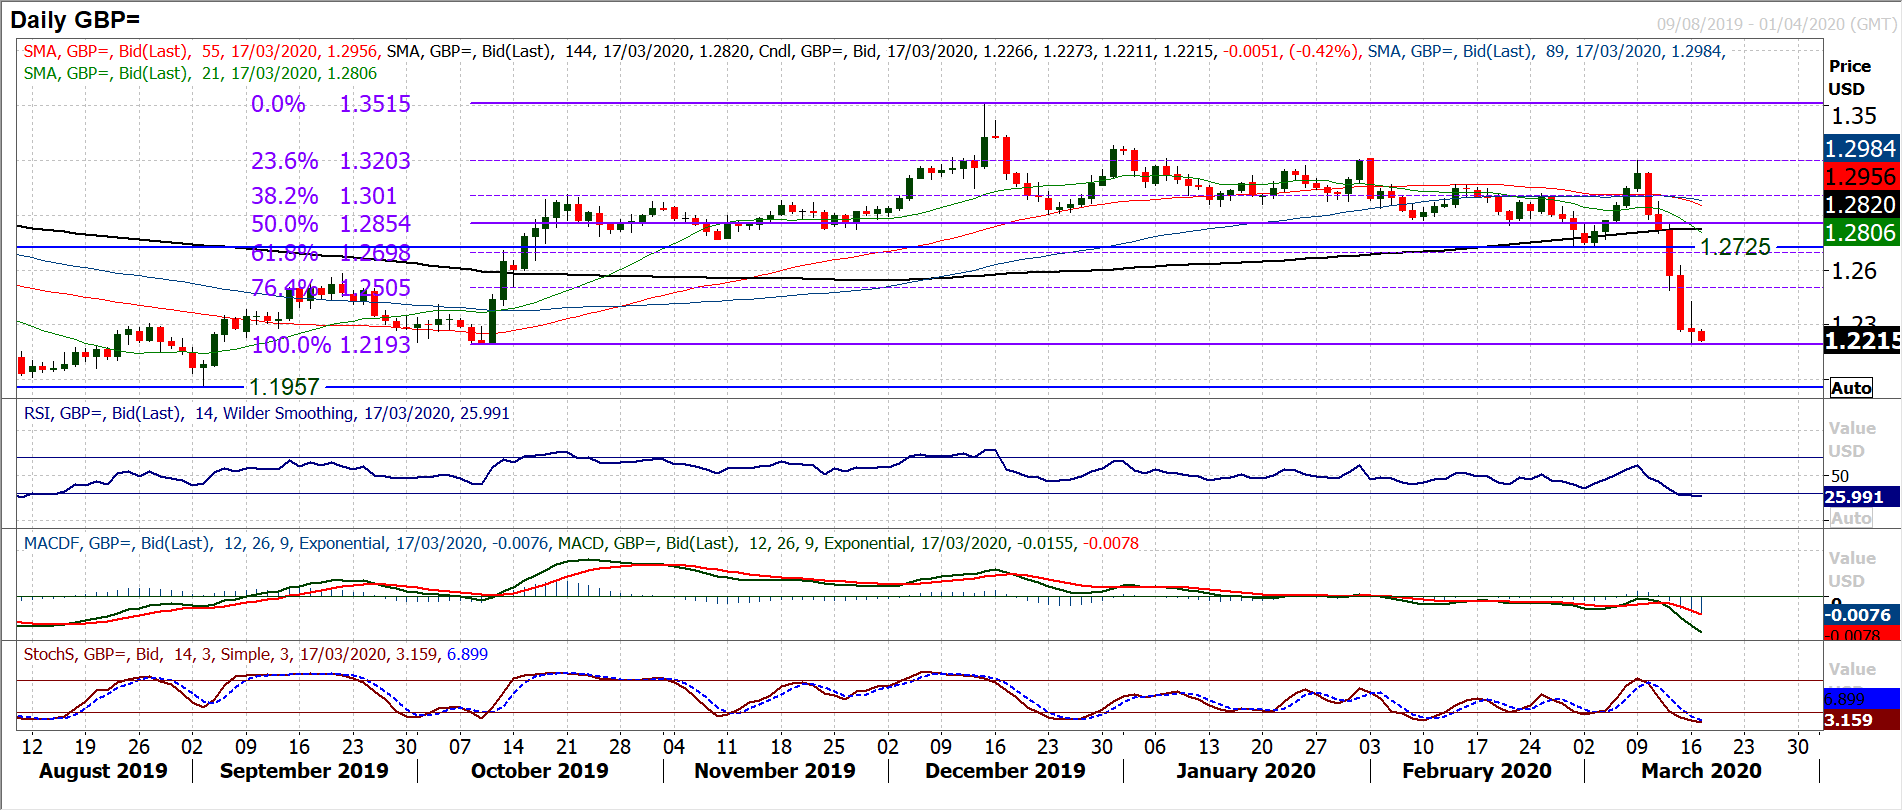
Cable remains stuck under the pressure of dollar strengthening, but at least the sharp move has been moderated to an extent by coordinated central bank action. However, intraday rallies continue to be sold into and that was once more a feature of yesterday’s session. The run of lower highs and lower lows continue to show on the hourly chart. An initial spike of dollar correction early yesterday, once more faded and Cable fell away again. With the price again falling initially today (albeit relatively calmly), we continue to expect a full retracement to $1.2193 which is the key October low. A close below $1.2193 opens the crucial low of $1.1957 from September. The intraday run of lower highs has left resistance at $1.2375, shown on the hourly chart as a level that was tested throughout the European morning yesterday before selling off again. Looking for potential recovery, therefore, this is currently now the first barrier that needs to be overcome. More considerable resistance is the spike high of $1.2430 which is the reaction high post the FOMC moves above which would be a confirmation signal.
USD/JPY
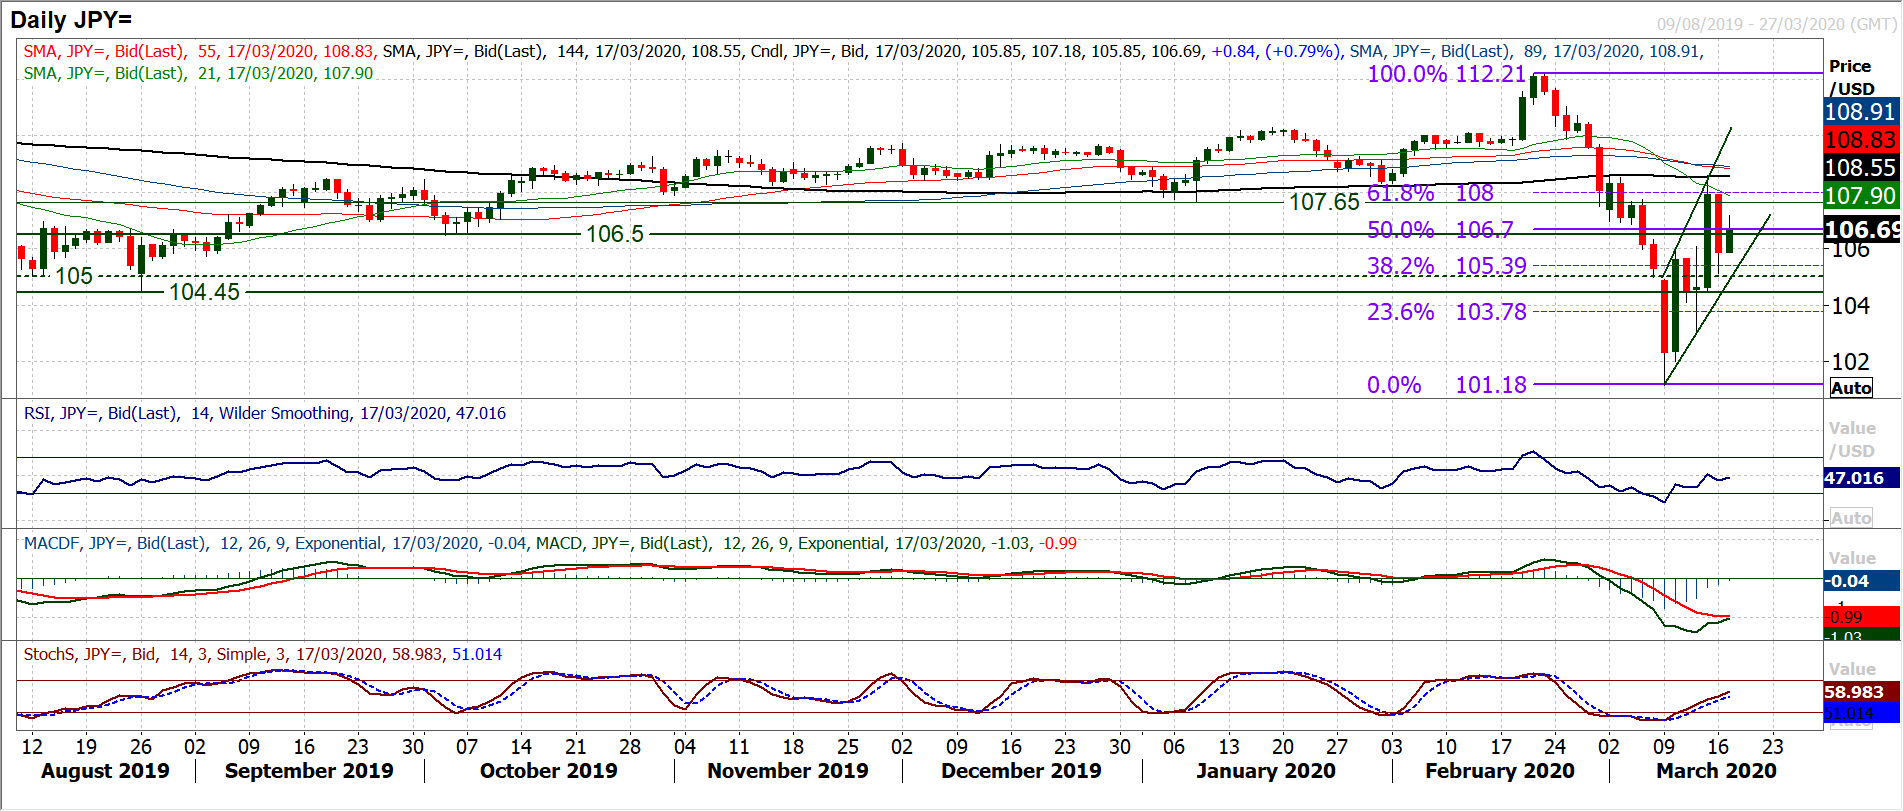
There was a continuation of the volatility across Dollar/Yen yesterday in the wake of the massive Fed action. This pulled the dollar lower and another strong move on Dollar/Yen. However, it seems to be a retracement move in what is increasingly a uptrend channel. Finding support at 105.15 yesterday the market has resumed its run higher today. This move over the past couple of weeks has pulled momentum indicators into an improving configuration, with Stochastics tracking decisively higher, RSI having picked up towards 50 and interestingly MACD lines on the brink of a bull cross. Coming towards the European session, the market is trading around the 50% Fibonacci retracement (of the massive 112.20/102.20 sell-off). So, given the construction of the uptrend channel and yesterday’s low (around the 38.2% Fib retracement of 105.40), the bulls will be looking for recovery momentum to pull through 50% Fib at 106.70 and put pressure on 61.8% Fib at 108.00. The hourly chart shows a series of higher lows forming now and 105.15 is taking on increased importance.
Gold
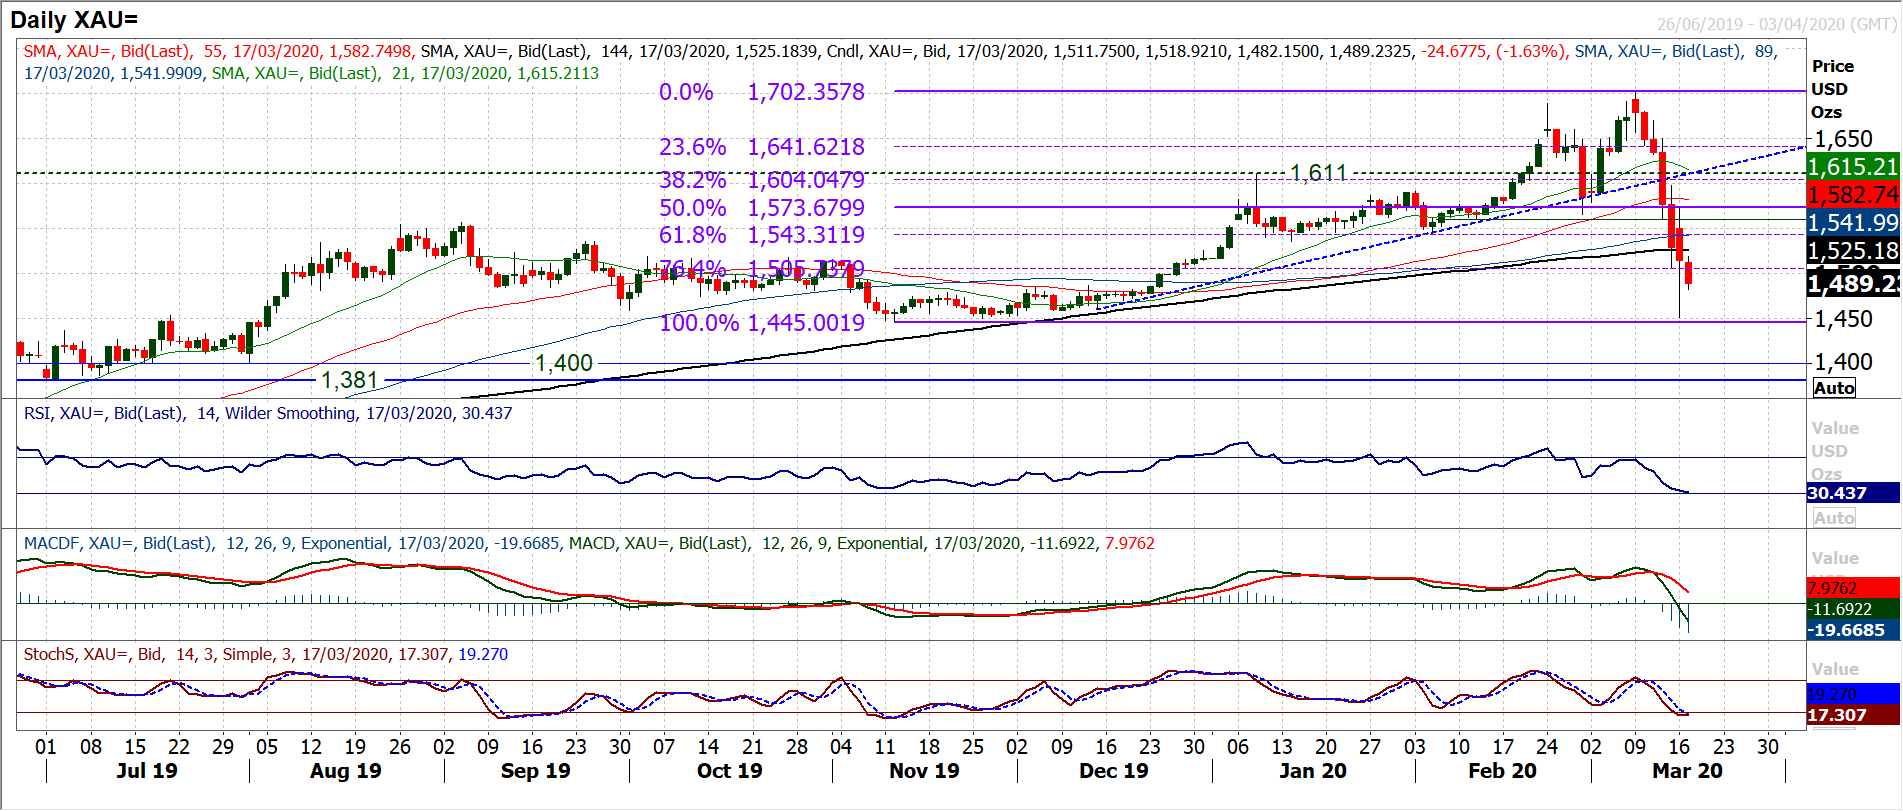
The decline of gold and its intraday volatility are astounding right now (although this can be said of a lot of markets). Yesterday’s daily range of $122 was the fourth largest high/low range ever on gold and was more than double the Average True Range of $54. The trouble is that the bulls just cannot get a handle on the sell-off right now. A run of enormous bear candles has continued even into today’s session. Momentum has now taken a decisive turn for the worse, with RSI hitting 30. This is the lowest since August 2018, when recovery first started to build into the bull market that has been a feature of the past 18 months. Whilst the daily chart shows bear candles, we remain cautious. This is a bear move that has momentum for now and our positive medium term outlook (of using weakness as a chance to buy gold) is now on review. We need to see evidence of sustainable recovery before we have any conviction that buying gold will not simply be sold into again. The hourly chart is failing at lower levels, with bearish configuration across hourly momentum indicators. The hourly RSI is consistently failing around 50 and hourly MACD failing under neutral. A series of lower highs have formed, with initially $1519 now resistance, whilst a downtrend has also formed (around $1555 this morning). Although the market rebounded off $1450 (a significant move with current volatility) the rolling over at $1519 looks to be eyeing this support again. This also came a handful of bucks above the key $1445 November low, a breach of which would be a critical moment that would massively change the long term outlook.
WTI Oil
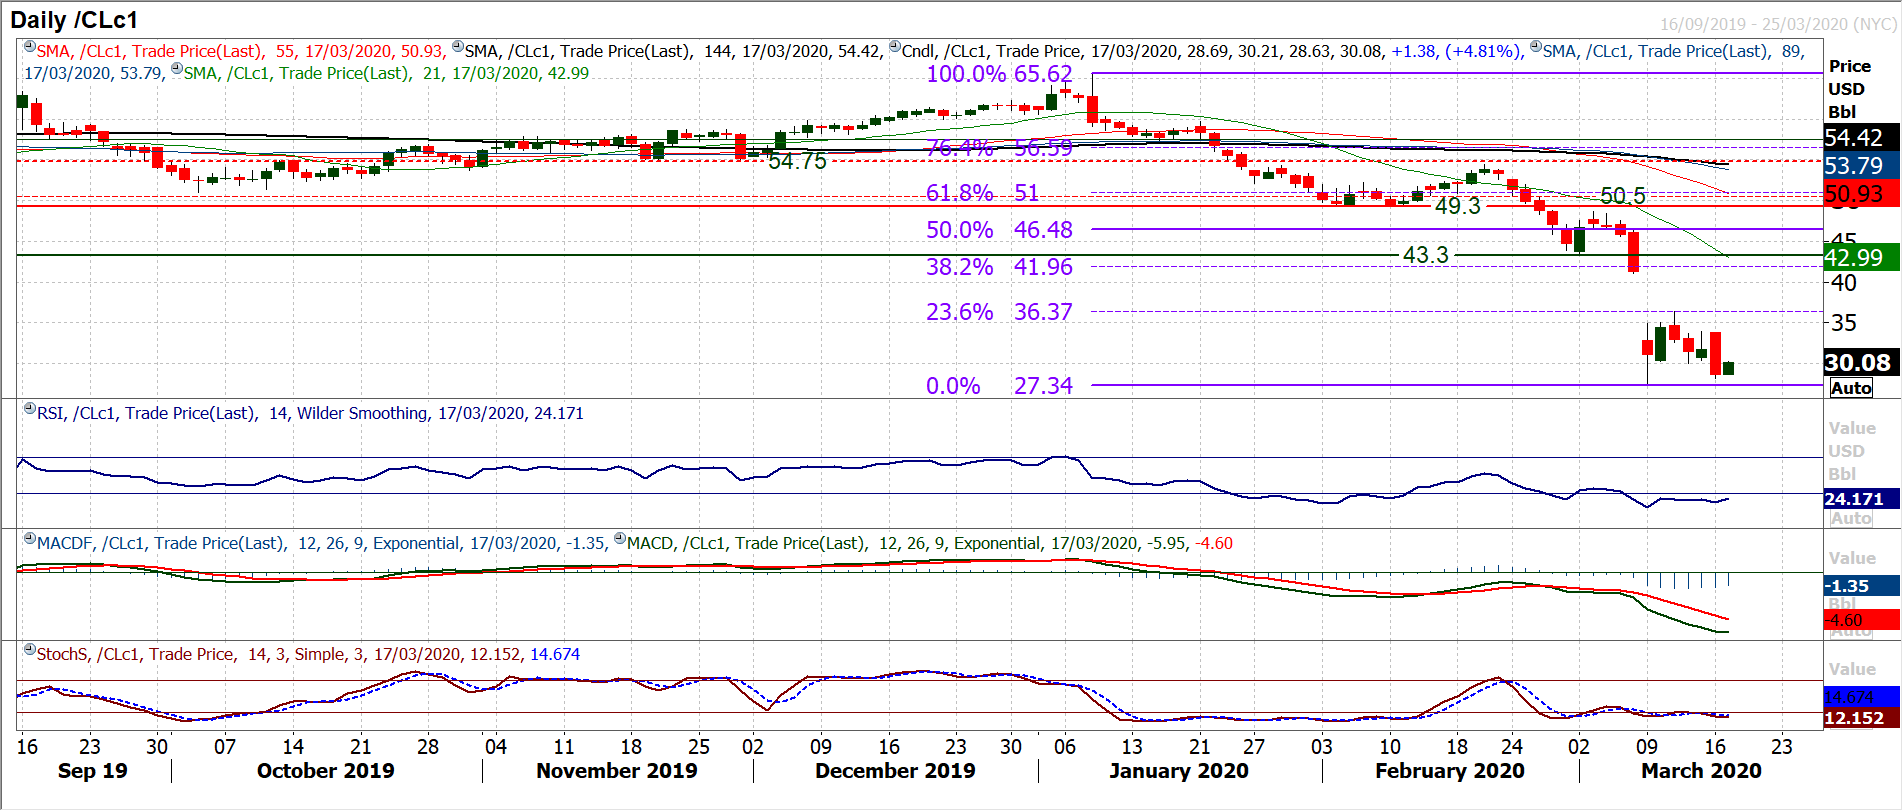
Oil has been rather choppy in recent sessions, moving around with sentiment on equity markets, but with the renewed negative outlook, the decisive bear candle has resulted in a closing breakdown below $30.00. This is the lowest level since February 2016 and suggests not only a retest of the huge spike low of $27.35 (from Monday 9th March) but also the crucial February 2016 lows at $27.05 is brewing. There has been a rebound early today, but we remain sceptical at this stage of how sustainable this move is. Momentum indicators remain in their negative configuration track lower, where RSI is in the mid-20s, whilst MACD and Stochastics deteriorate within their bearish positioning. There is an ongoing struggle for the bulls for any sustainable traction and intraday rallies are seen as a chance to sell. Resistance is built up at $33.75/$33.85 the latest lower high under the $36.35 high from last week (which coincided with the 23.6% Fibonacci retracement of $65.60/$27.35 at $36.35).
Dow Jones Industrial Average
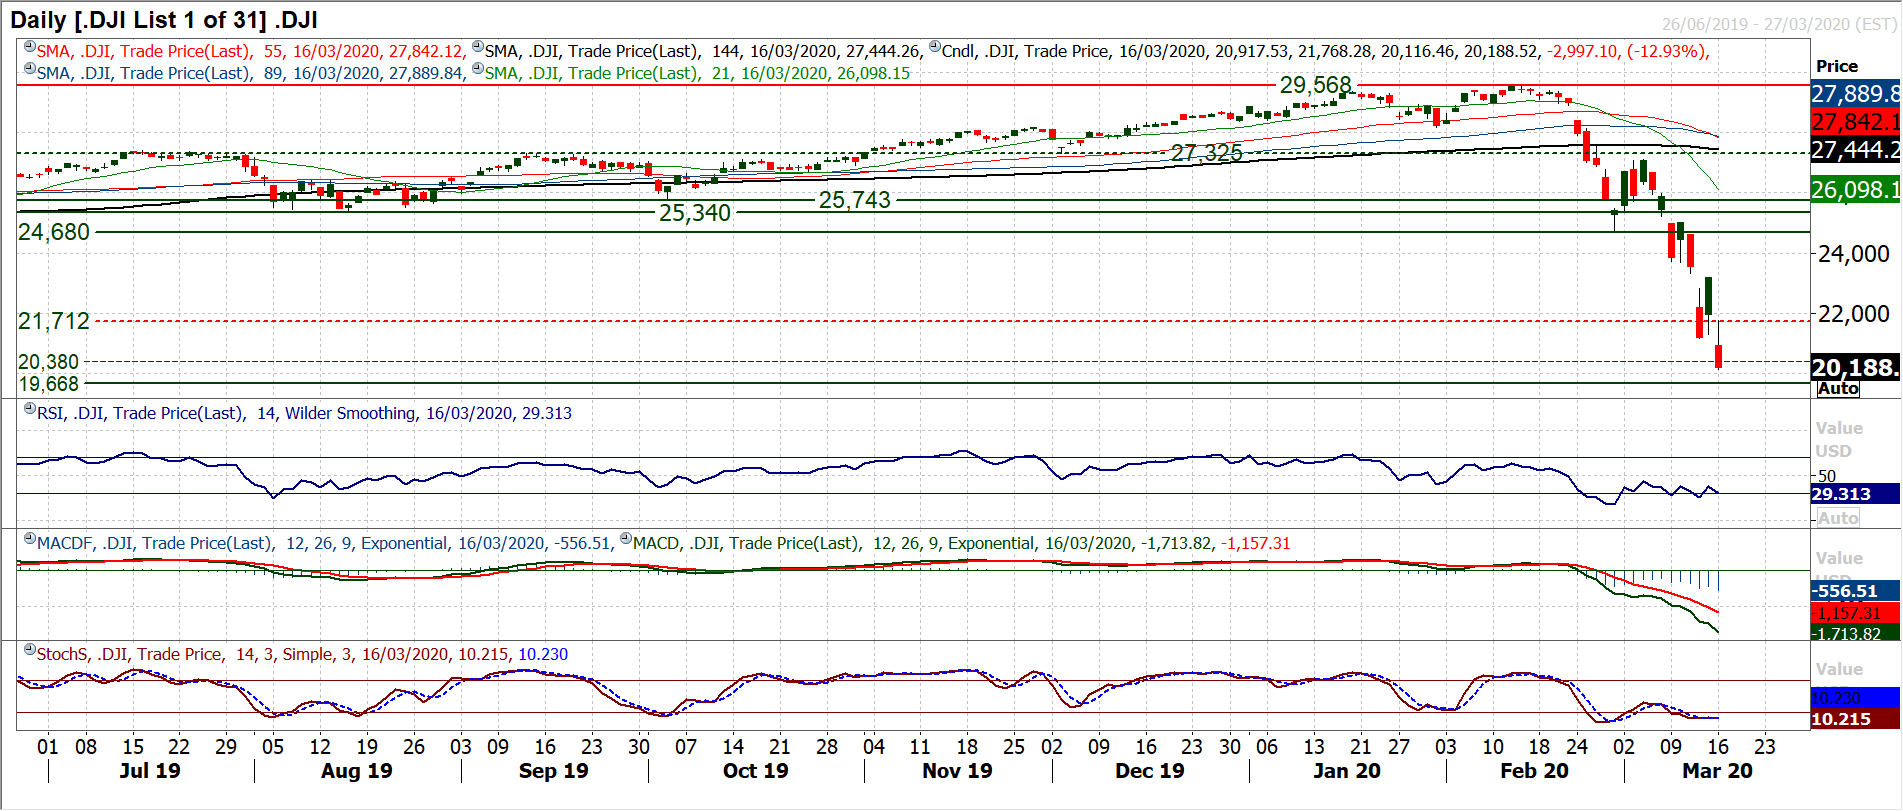
Another absolute car crash of a session on Wall Street ended with the Dow -12.9% lower and just a handful of ticks shy of -3000 ticks taken off the market. Incredibly, the Dow has now wiped out all of the gains of the past three years, trading at its lowest level since February 2017. A breach of the next massive psychological level of 20,000 the next support is at 19,670. Momentum is extremely bearish still and there is little real sign of sustainable recovery brewing quite yet. However, the futures are looking a little brighter today and the bulls will be looking for their first step forward. That is “closing” the gap at 21,285. This gap was filled yesterday but if it can now be closed then it would at least be a positive sign. The previous two gaps in the past week have not even been filled. Yesterday’s high of 21,768 then becomes a key point of resistance too. Right now, the bulls need any sense of hope to cling on to.
