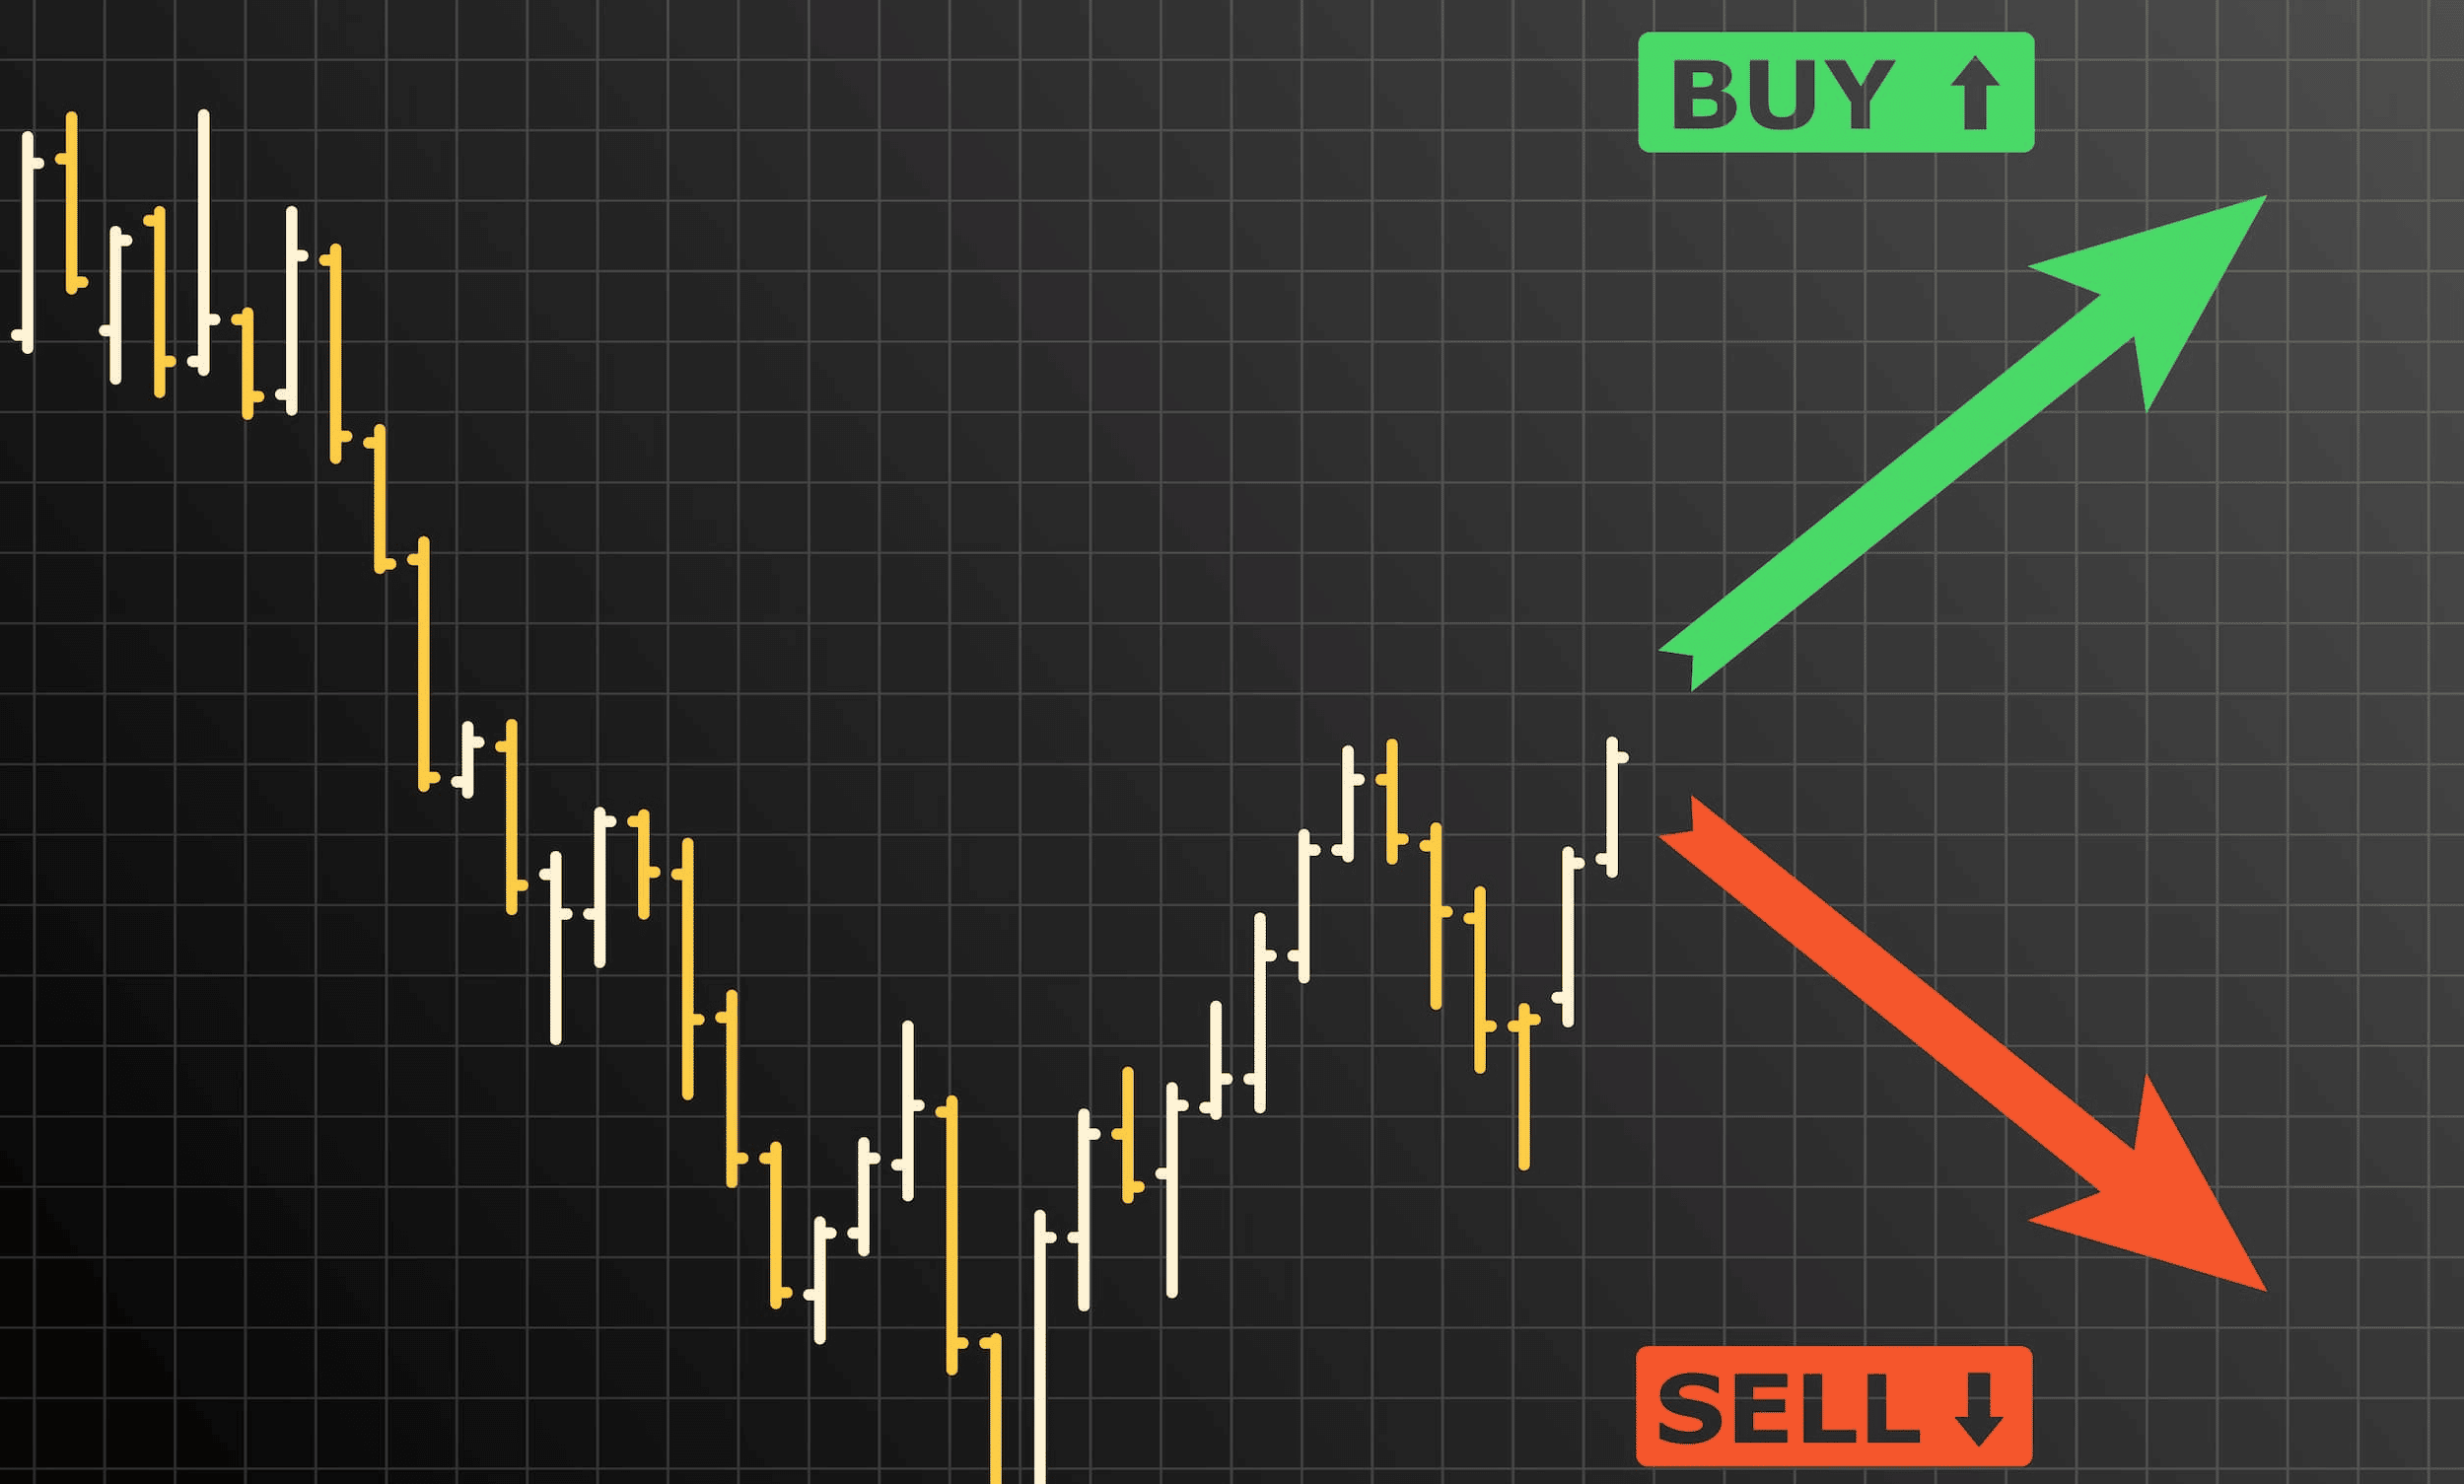
In the late 19th century, Charles Dow (who gave his name to the Dow Jones Industrial Average) identified ways of analysing financial markets, which are now collectively known as the Dow Theory. One of the primary lessons from Dow Theory is that markets move in trends, there being three types of trends: up, down, and sideways. For technical analysts and traders, identifying when a market is in a trend (up or down) or when it is in a sideways trend or is range-bound, is key to any trading strategy.
In this article we will look at:
What Defines a Trending Market?
Markets do not move in straight lines but in a series of peaks and troughs. A Dow Theory up trend is defined by a series of successively higher peaks and higher troughs. Whereas a downtrend is a series of sequentially lower peaks and lower troughs.
What Defines a Range-Bound Market?
Sometimes the market does not move with successively higher peaks and higher troughs, or sequentially lower peaks and lower troughs. But rather it moves with random peaks and troughs, some higher and some lower than previous peaks and troughs. We define this as a sideways trend, or more commonly, a range-bound market.
Moving on from just looking at up, down, and sideways trends defined by peaks and troughs, technical analysts and traders also use trend lines to better define the limits of trending and range-bound markets.
What Is a Trend Line?
A trend line is a line that’s drawn between two points — generally off from the notable highs or lows. Traders use these lines to define a trend or a range-bound market. A trend line would be drawn off the highs in a downtrend, and the lows in an uptrend.
How Do Trend Lines Work?
Trend lines work by defining support and resistance, which you can then use to enter or exit trades. They also let you know when a market might change direction — for example, from a bullish to a neutral phase. Or from a sideways stage to a bearish or bullish trend with a breakout. You can learn more about this in our Breakout Trading Guide.
What Are the Different Types of Trend line?
The different types of trend lines are broadly categorised as:
- An uptrend line
- A downtrend line
- A sideways, or consolidation trend line
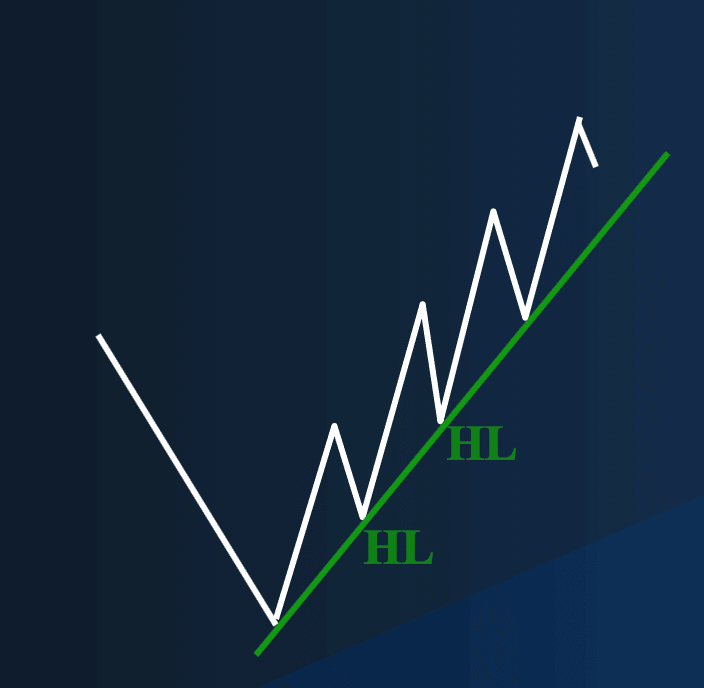
Up Trend (Higher Lows)
An uptrend is a series of higher highs and higher lows. As you’ll see in the image below, the trend line is drawn by connecting successive swing lows that define the uptrend. You can then use this uptrend line as support.
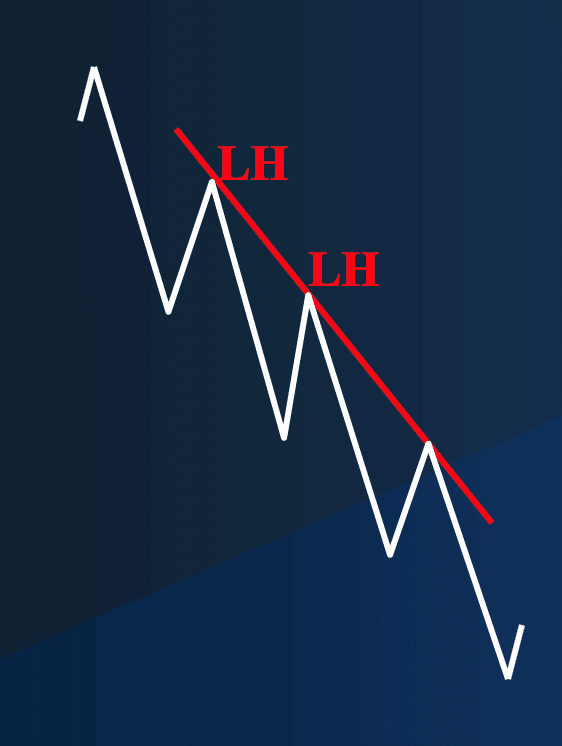
Down Trend (Lower Highs)
You’ll recognise a downtrend by a series of lower lows and lower highs, as seen in the image below. Simply connect the significant highs with your trend line and you’ll be able to use it as resistance.
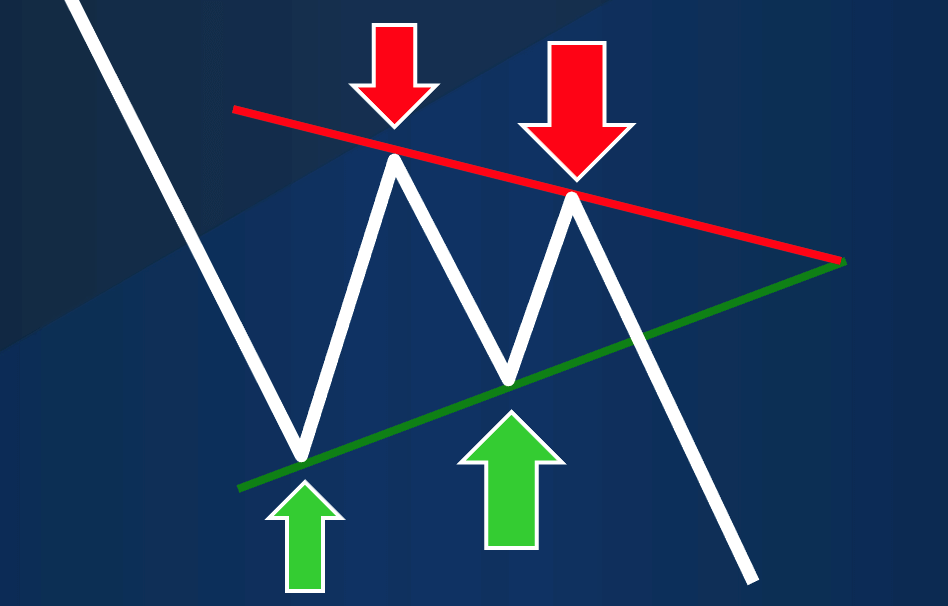
Sideways Trend (Range-bound)
In the sideways, range-bound market you can also draw trendlines that don’t define an up or downtrend, but actually define the sideways trend or range-bound market. These trend lines in range-bound markets both define the range, but can also help signal breakouts from the range.
What Are the Pros and Cons of Trend Line Trading?
Pros Of Trend Line Trading
The advantages of trend line trading are:
- A trend line break signals the end of a trend — You can define when a trend concludes when the trend line is broken
- Can help to define trade entry levels— You can use breaks of trend lines as entry levels for your trading strategies
- Can help to define trade exit levels— You could use a breach of a trend line as a reason for exiting a trade, to place an exit stop on a break of a trend line
- Trend line trading can provide earlier signals (than when using other indicators) — Earlier signals are often generated from using a trend line to enter or exit trades, as opposed to using other support and resistance levels for signals
- You can increase your profits — The above uses of trend lines can improve your profits (though fake breaks could be negative for profits — see the cons of trend line trading below)
Cons Of Trend Line Trading
- The main disadvantage of trend line trading is that, sometimes, fake signals are given. For example, in an uptrend, the rising trend line might break, but the next support might hold, and the uptrend may then resume
- You may look to trade the range-bound market, by selling at the top of the range and buying at the top of the range. Or you might look for breakouts from sideways, ranges, but these breakouts can also sometimes be fake (or fakeouts as they are often called).
Takeaways
You should now have a better understanding of what trending and rangebound markets are, how to define them and how to use trend lines in up, down, and sideways, range-bound markets.
These new technical analysis skills, when applied to your trading strategy should enable you to better define entry and exit levels for your trades, and with refinement, improve your trading results, and in the long run, your profitability.
